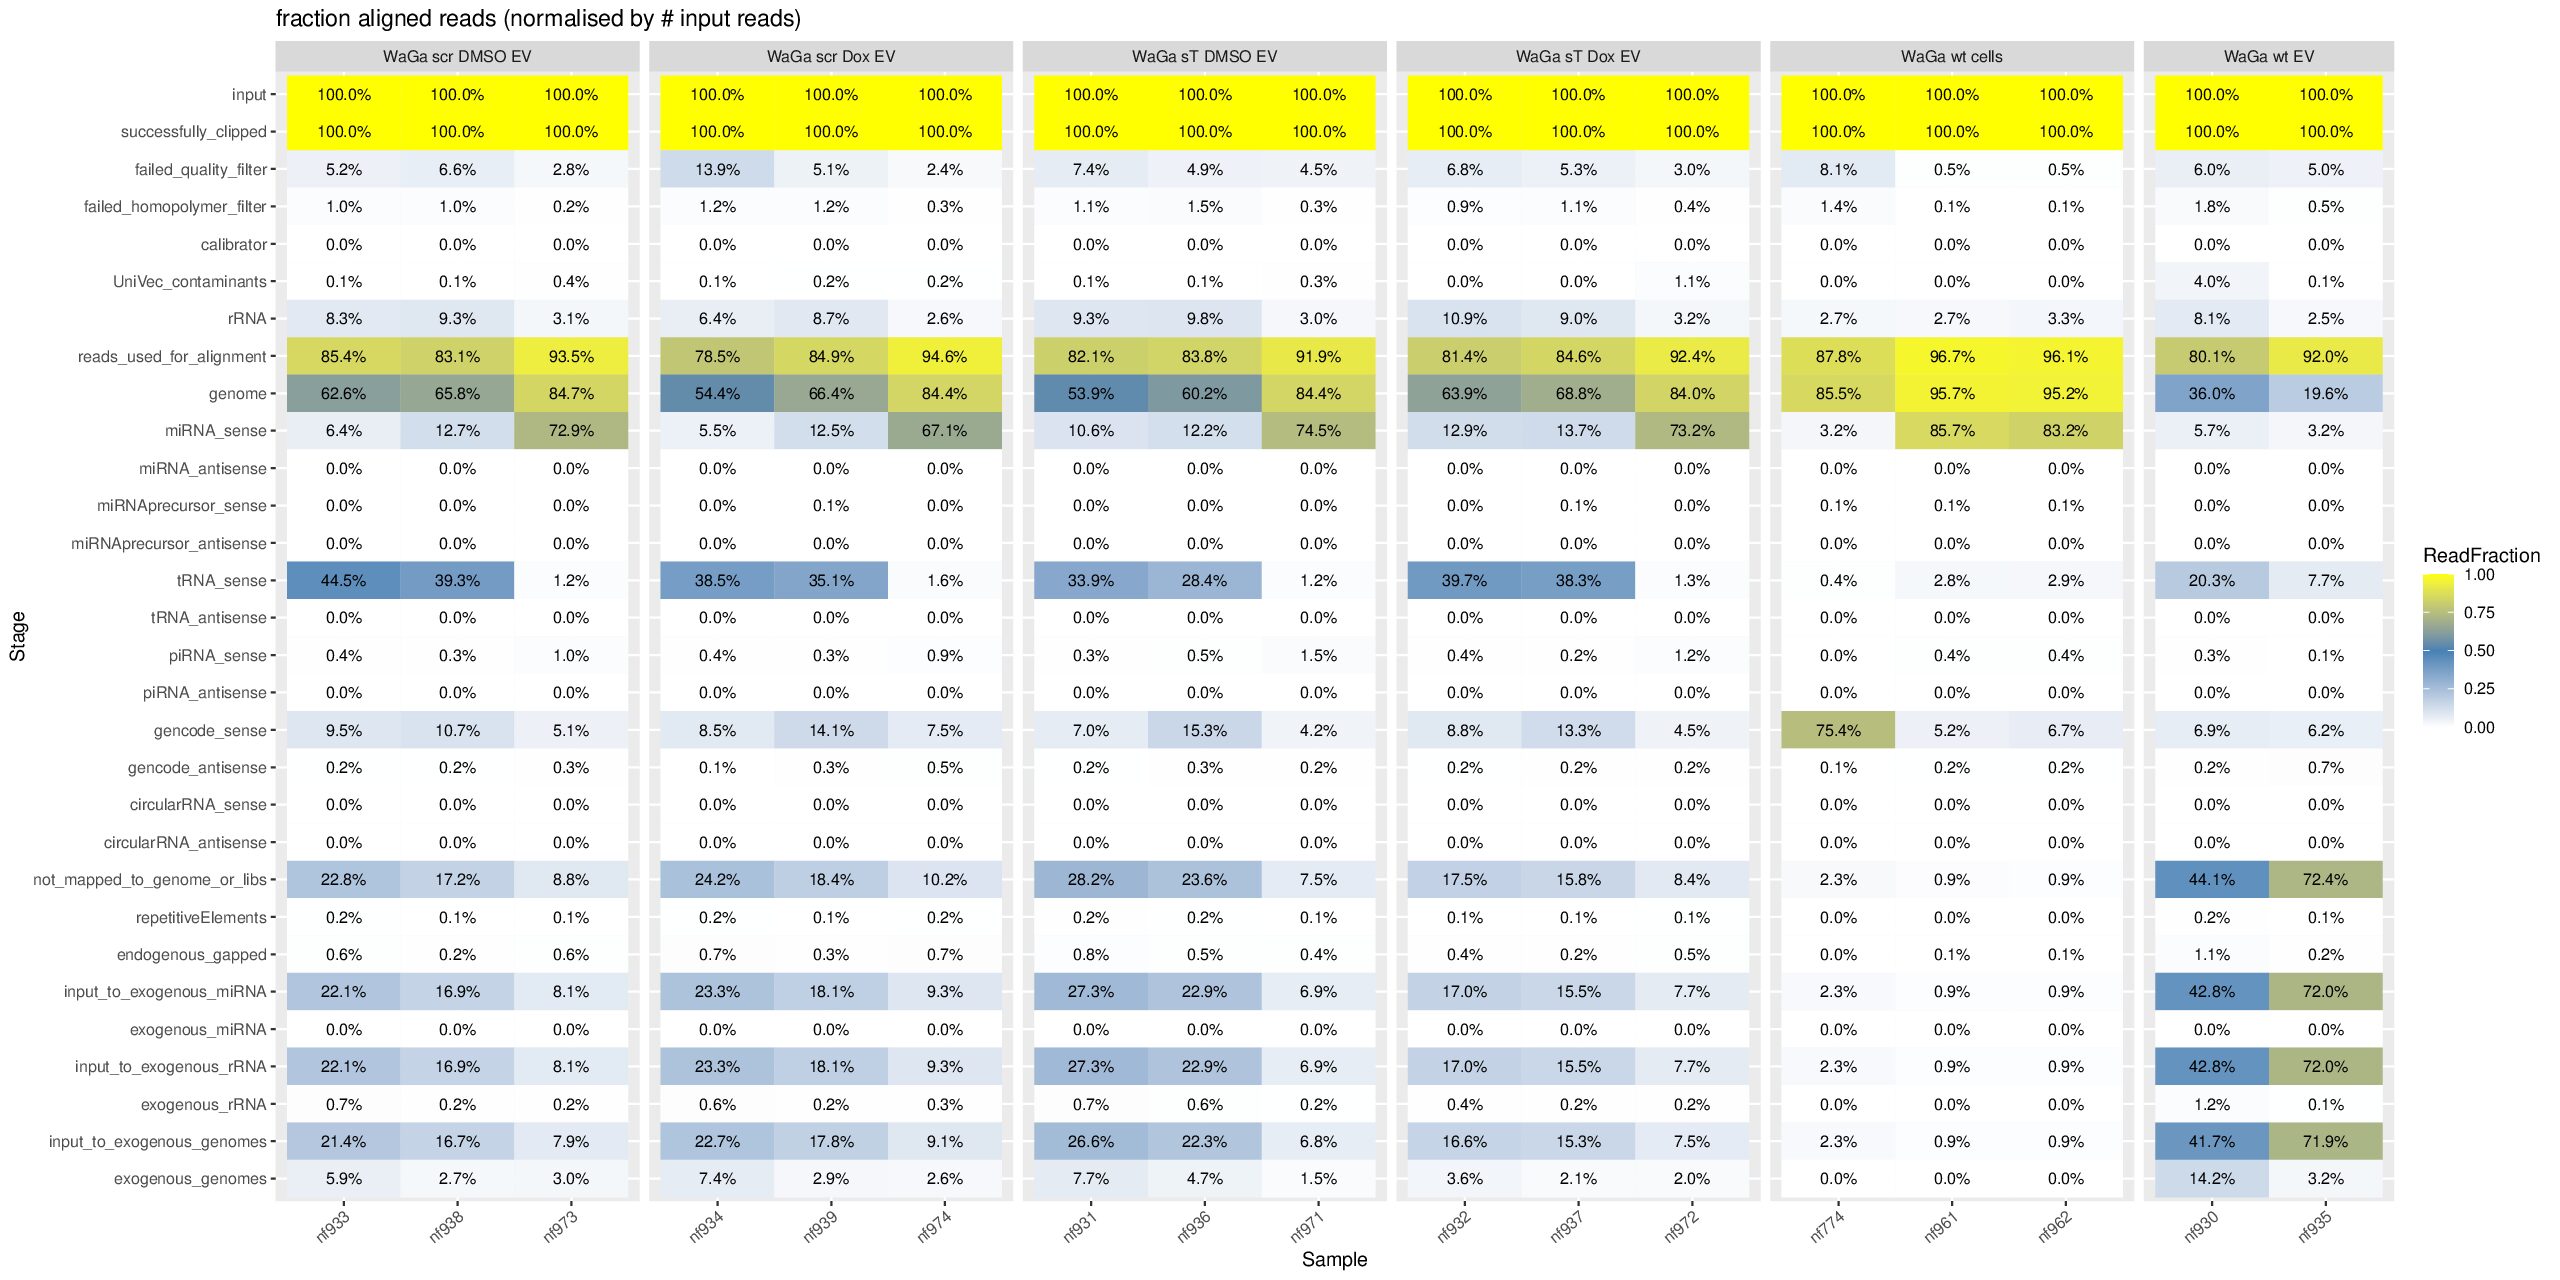
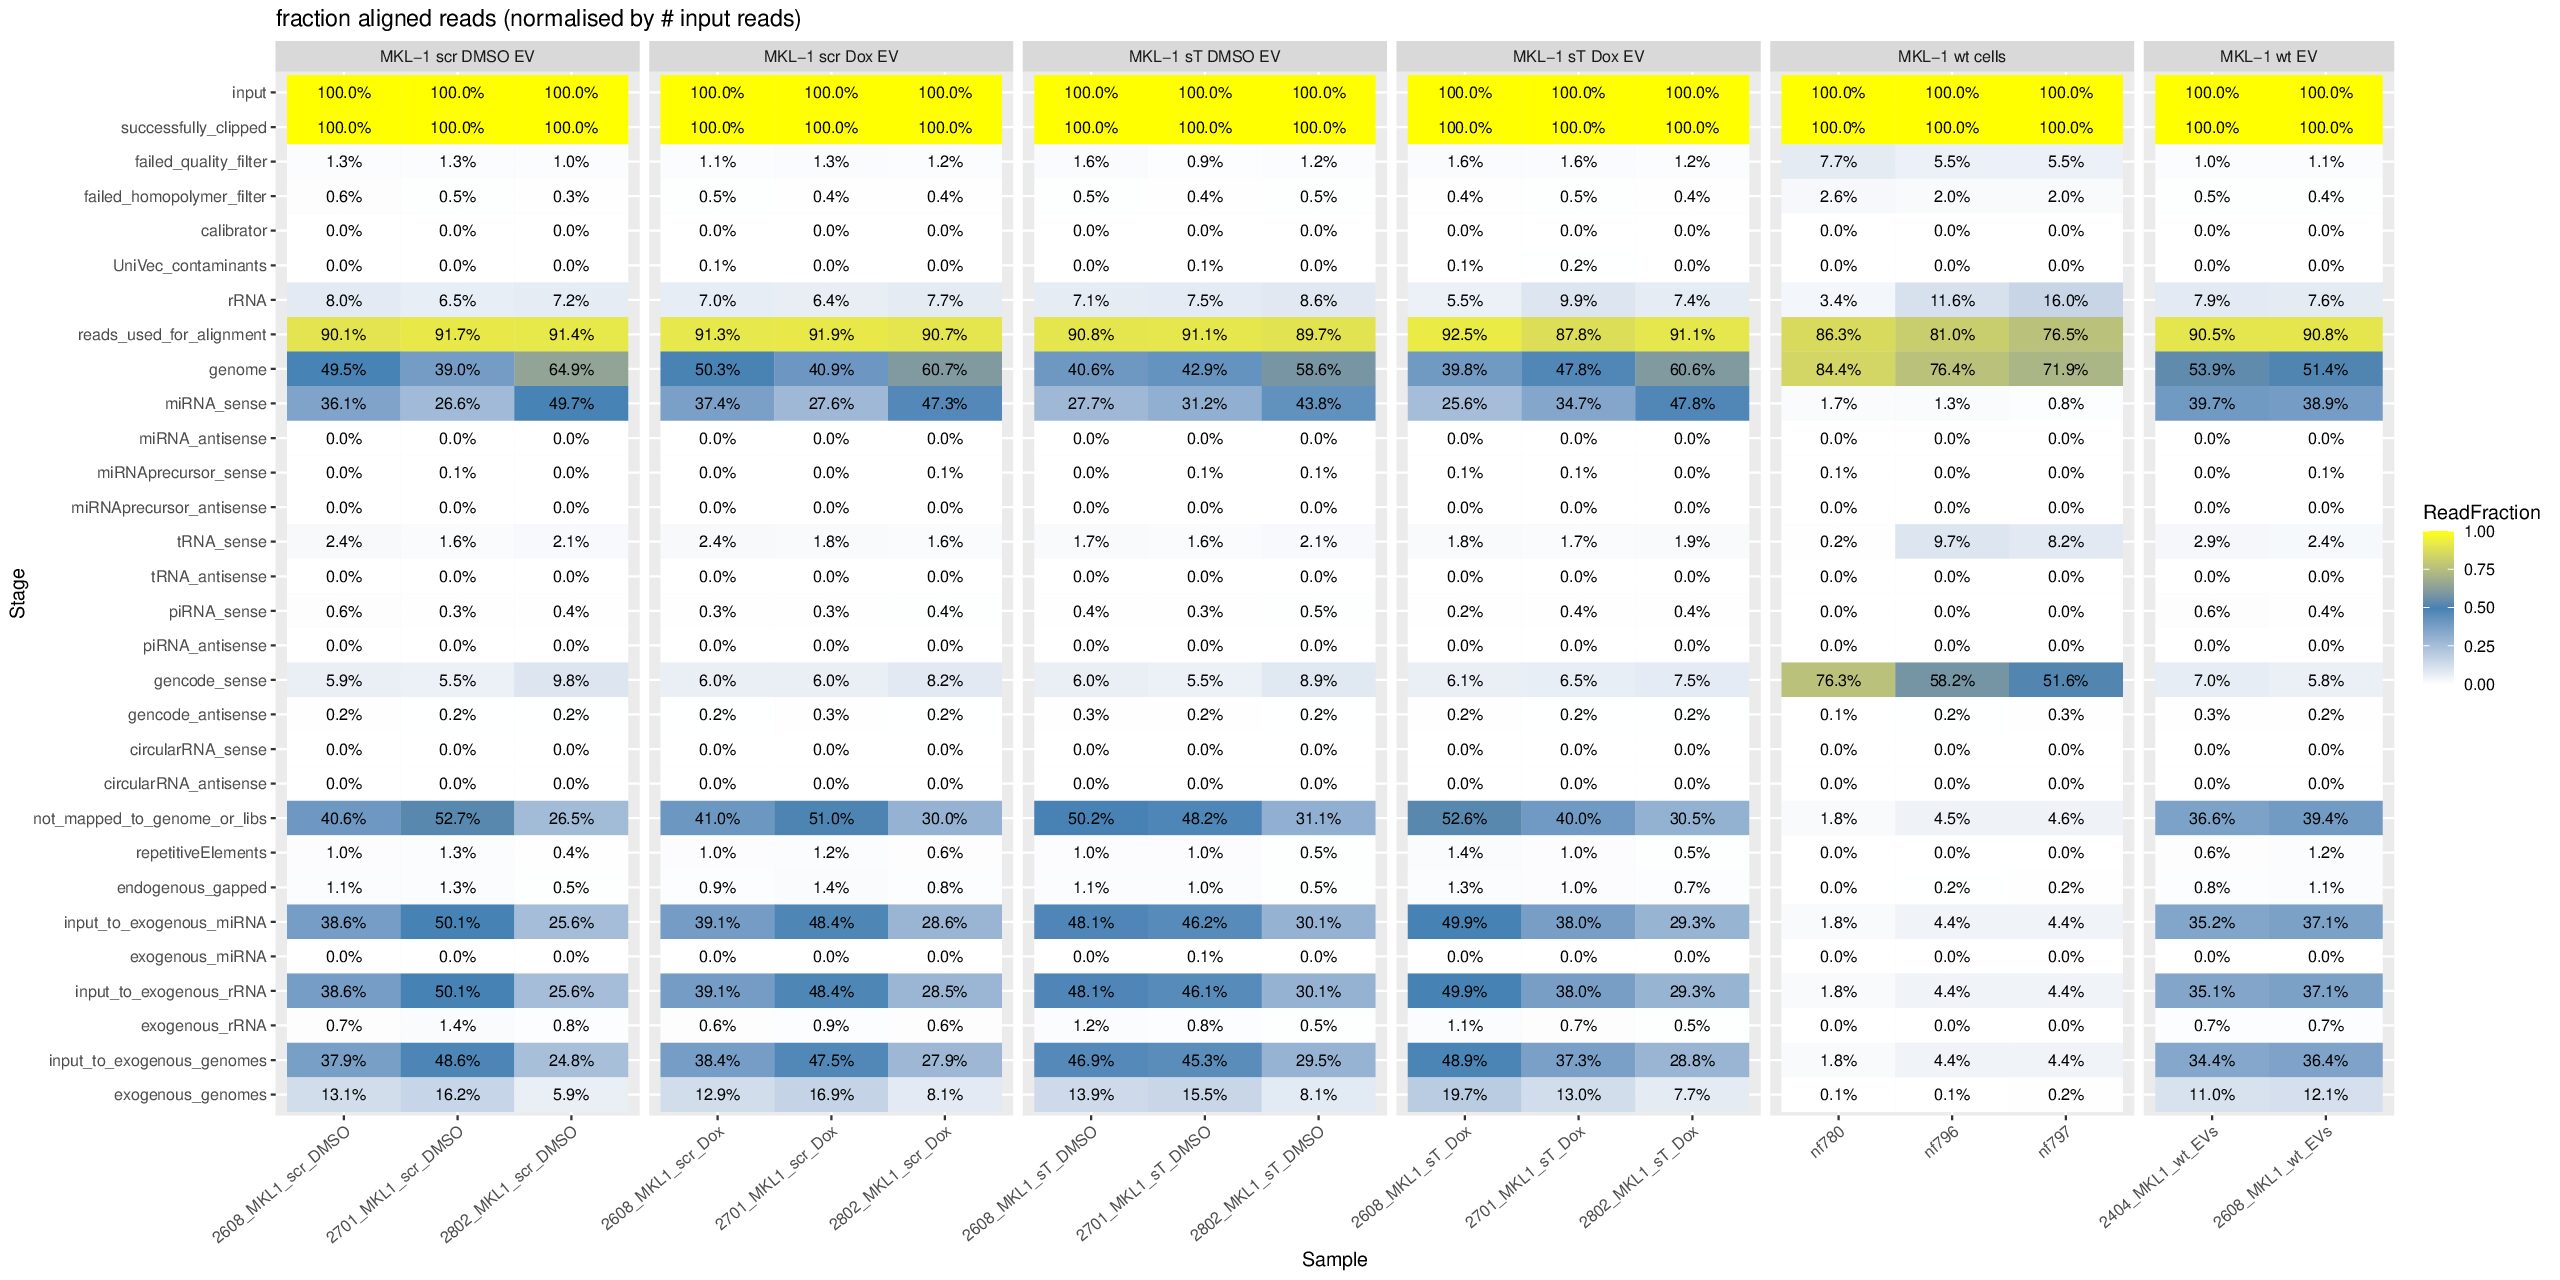
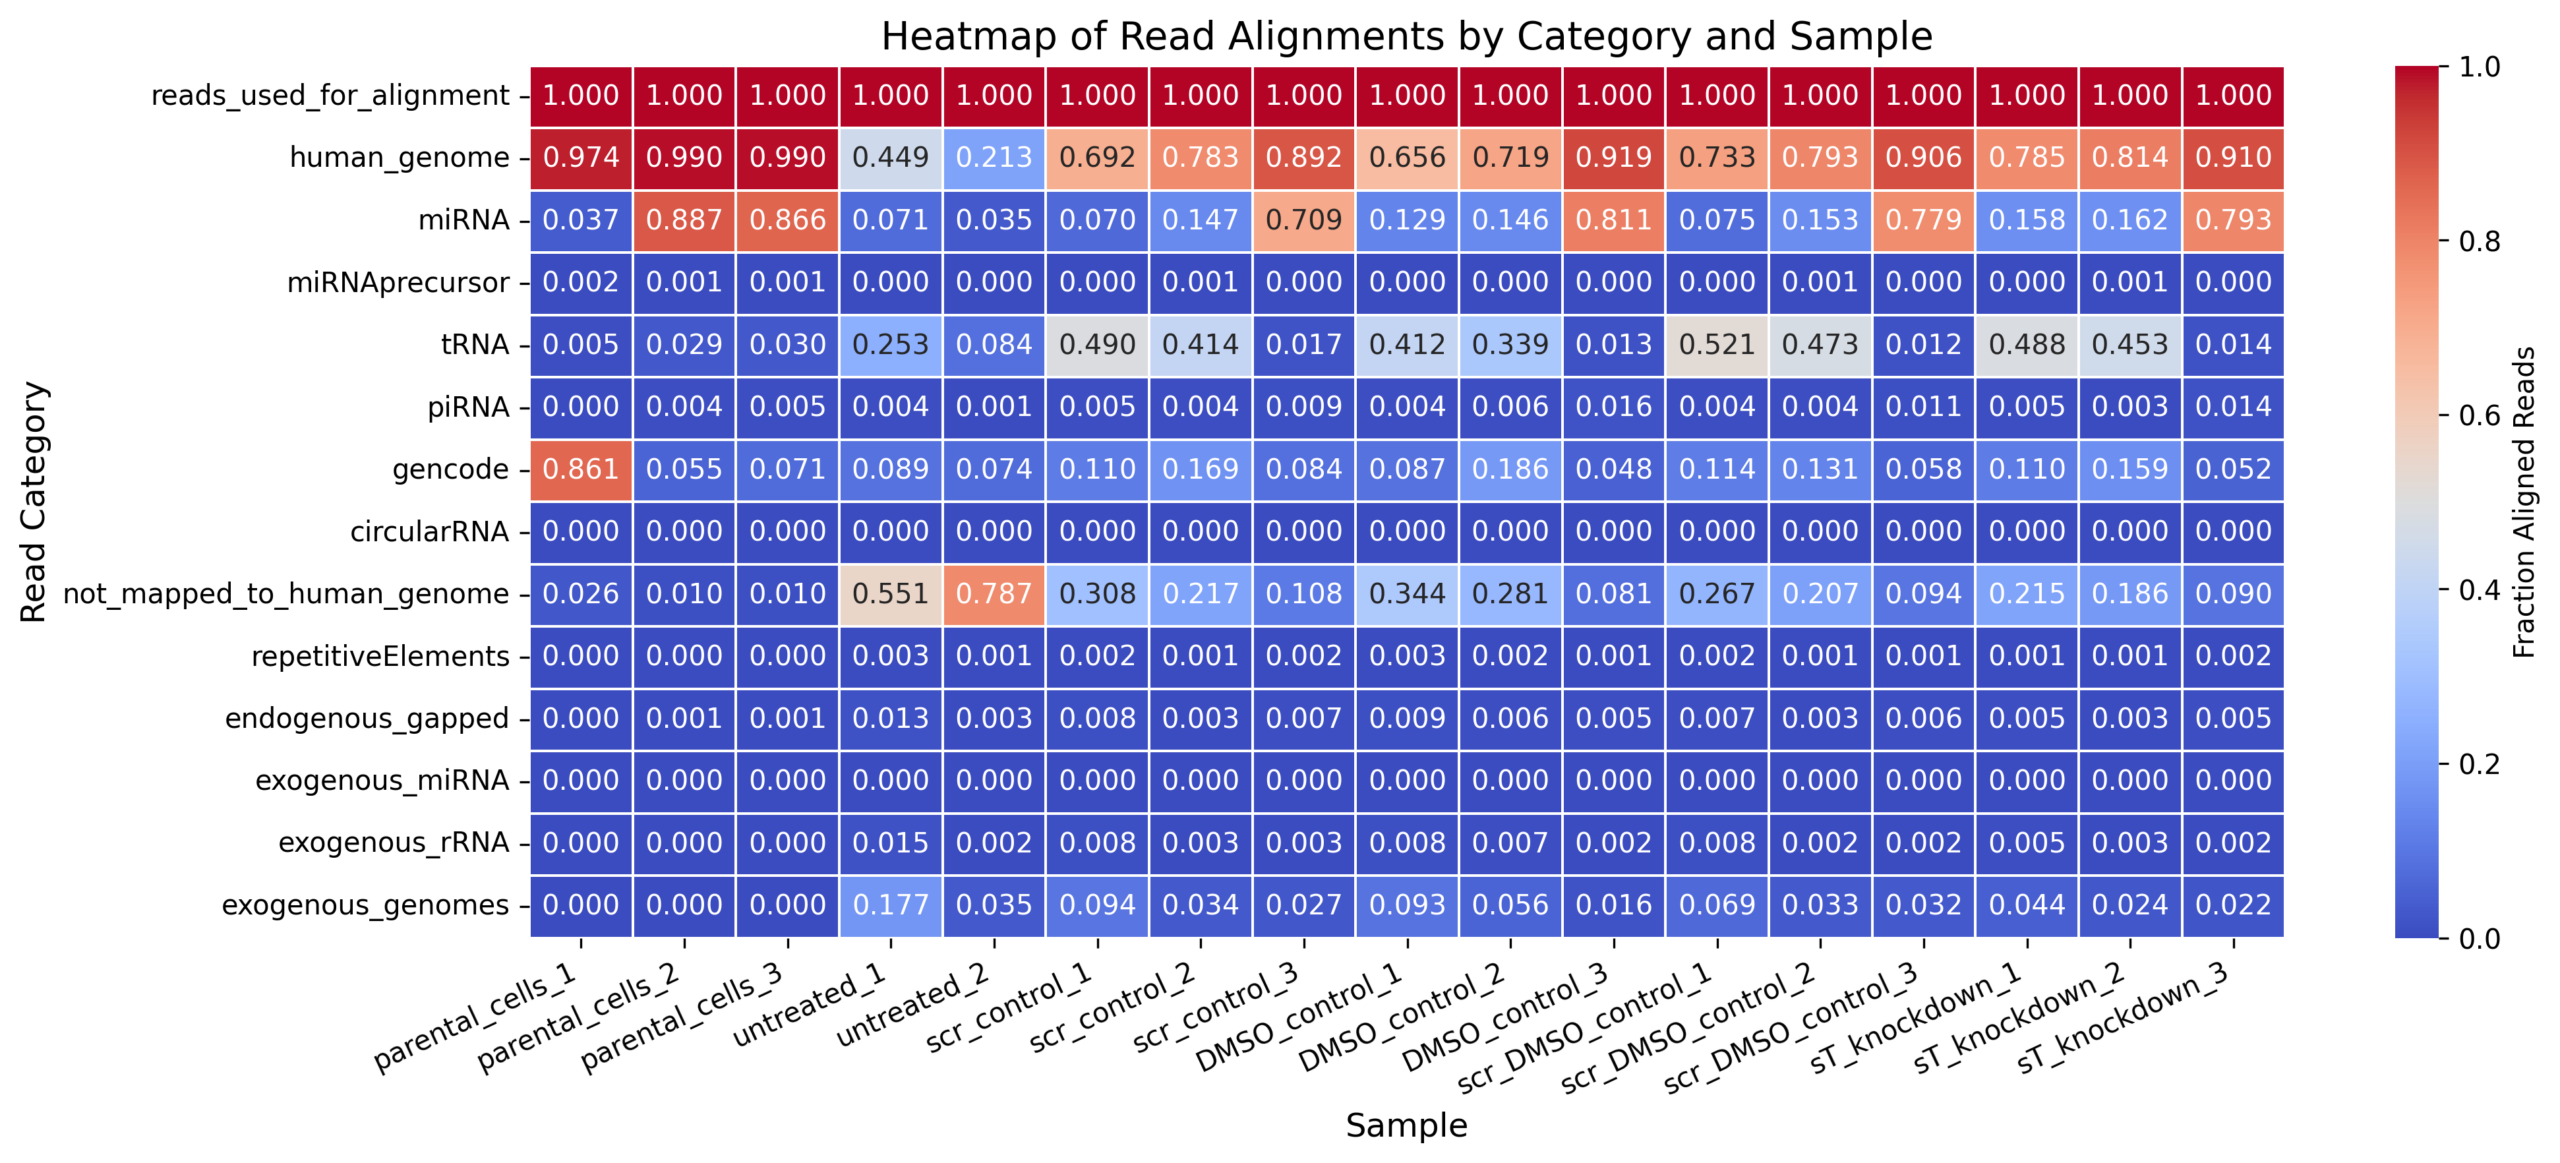
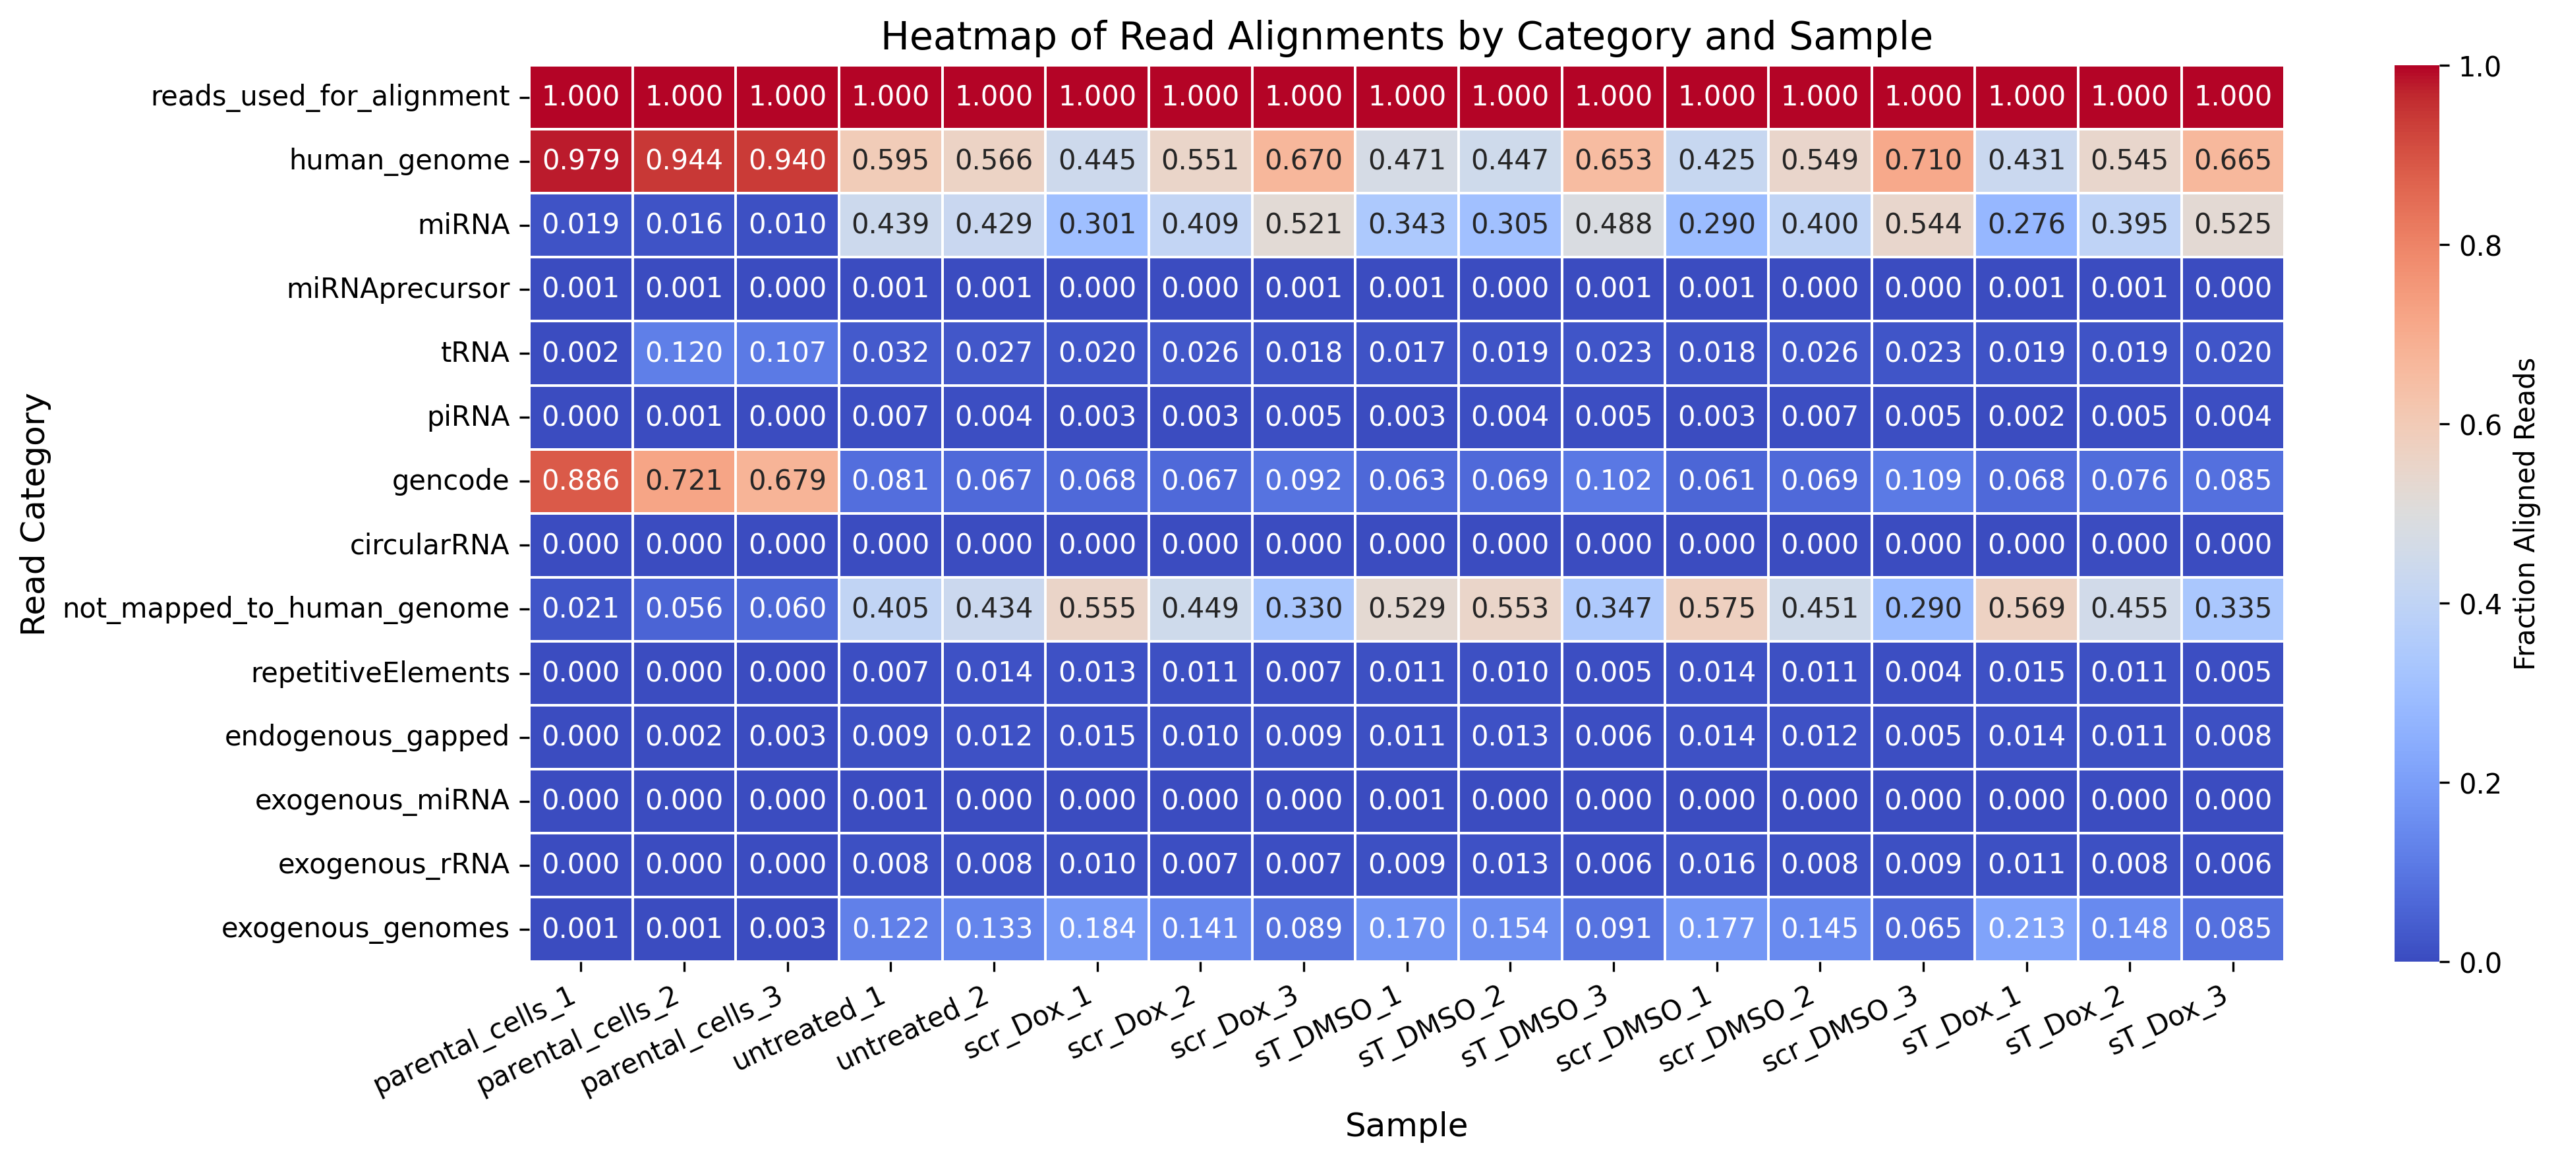
For MKL-1, the two files are complementary, not interchangeable.
exceRpt_biotypeCounts.txt= biotype abundance / composition tableexceRpt_mapping_heatmaps_MKL-1.xlsx= mapping/QC summary table
Comparison table for MKL-1 files
| Feature | exceRpt_biotypeCounts.txt |
exceRpt_mapping_heatmaps_MKL-1.xlsx |
|---|---|---|
| Main purpose | Shows how many reads/abundance estimates were assigned to different RNA biotypes | Shows how reads progressed through QC, trimming, alignment, and mapping categories |
| Data type | Biotype-level abundance table | Mapping/QC fraction table, likely normalized to input reads |
| MKL-1 samples included | Same MKL-1 sample set: 2404_MKL1_wt_EVs, 2608_MKL1_scr_DMSO, 2608_MKL1_scr_Dox, 2608_MKL1_sT_DMSO, 2608_MKL1_sT_Dox, 2608_MKL1_wt_EVs, 2701_MKL1_scr_DMSO, 2701_MKL1_scr_Dox, 2701_MKL1_sT_DMSO, 2701_MKL1_sT_Dox, 2802_MKL1_scr_DMSO, 2802_MKL1_scr_Dox, 2802_MKL1_sT_DMSO, 2802_MKL1_sT_Dox, plus nf780, nf796, nf797 |
Same sample list as the biotypeCounts file |
| Format | Plain text / tab-delimited table | Excel file |
| Values | Numeric abundance values for RNA biotypes. Some values are fractional, suggesting normalized or fractional assignment rather than simple integer raw counts | Values appear to be fractions/proportions, with input = 1 |
| Main biological categories | miRNA, tRNA, piRNA, snRNA, snoRNA, rRNA, protein_coding, lincRNA, retained_intron, processed_transcript, antisense, misc_RNA, exogenous_genomes, exogenous_miRNA, exogenous_rRNA, circularRNA, etc. | input, successfully_clipped, failed_quality_filter, failed_homopolymer_filter, UniVec_contaminants, rRNA, reads_used_for_alignment, genome, miRNA_sense/antisense, tRNA_sense/antisense, piRNA_sense/antisense, gencode_sense/antisense, circularRNA_sense/antisense, not_mapped_to_genome_or_libs, repetitiveElements, exogenous_genomes, etc. |
| Best used for | Small RNA composition plots, e.g. miRNA / tRNA / piRNA / long RNA biotype percentages | Mapping efficiency, QC filtering, alignment statistics, and reproducibility of how reads were distributed |
| Most relevant manuscript panel | Figure 4A and Supplementary Figure S5A: small RNA biotype composition | Mapping/QC text, e.g. percentage of reads mapped, and supplementary QC information |
| Strength | Directly supports the biological small RNA composition results | Directly supports mapping quality and reproducibility |
| Limitation | Does not show QC/mapping steps such as adapter clipping, quality filtering, unmapped reads, etc. | Does not provide the full biotype abundance table needed to reproduce Figure 4A/S5A |
| Repository suitability | High, if converted to clean CSV/TSV and accompanied by sample metadata | Moderate to high, but should be converted from Excel to CSV/TSV and clearly labeled as mapping/QC summary |
| Enough for miRNA-level figures? | No. It gives total miRNA abundance, but not individual miRNA counts/RPM | No. It gives mapping fractions, not individual miRNA abundance |
Which file should you submit?
Best recommendation
Submit both, but with different roles:
| File | Submit? | Role |
|---|---|---|
exceRpt_biotypeCounts.txt |
Yes — main processed small RNA biotype file | Supports small RNA biotype composition, e.g. Figure 4A / Suppl. Fig. S5A |
exceRpt_mapping_heatmaps_MKL-1.xlsx |
Yes — secondary mapping/QC file | Supports mapping efficiency and QC reproducibility |
If you can upload only one file, submit:
exceRpt_biotypeCounts.txt
because it is closer to the actual biological small RNA composition results shown in the manuscript.
However, the best processed-data package would be:
smallRNA_exceRpt_biotypeCounts_MKL-1.csv
smallRNA_exceRpt_mapping_summary_MKL-1.csv
smallRNA_sample_metadata_MKL-1.txt
Important practical suggestions before submission
-
Convert the Excel mapping file to CSV/TSV
Many repositories prefer plain text files. For example:
exceRpt_mapping_heatmaps_MKL-1.xlsxcould become:
smallRNA_exceRpt_mapping_summary_MKL-1.csv -
Clarify the value type in
exceRpt_biotypeCounts.txtThe values are not all integers. Before submission, check whether this file contains:
- raw read counts,
- normalized counts,
- RPM/CPM,
- or exceRpt fractional assignment values.
Add a short README or column description, for example:
Values are exceRpt-derived biotype abundance estimates.or, if confirmed:
Values are read counts assigned to RNA biotypes by exceRpt. -
Define the mapping categories
In the mapping heatmap file, categories such as:
reads_used_for_alignmentgenomenot_mapped_to_genome_or_libsgencode_sensemiRNA_sense
should be explained in a README. Otherwise reviewers may not know which row corresponds to “reads mapped to the human genome”.
-
Decide what to do with
nf780,nf796, andnf797These samples are included in both files but are not MKL-1 EV samples. If they are not part of the manuscript figures, you should either:
- remove them from the MKL-1 processed table, or
- keep them but clearly annotate them in the metadata as non-MKL-1/control samples.
-
You still need an individual miRNA table
Neither of these two files is sufficient for the individual miRNA Manhattan plots or miRNA-level analyses, e.g. Figure 4B or Supplementary Figure S5B. For those, you should also provide:
smallRNA_miRNA_counts_all_samples.txt
smallRNA_miRNA_RPM_normalized_all_samples.txt
if those were used for the figures.
Final suggestion
For MKL-1:
Primary processed file to submit:
exceRpt_biotypeCounts.txt
→ rename to smallRNA_exceRpt_biotypeCounts_MKL-1.csv

Secondary processed file to submit:
exceRpt_mapping_heatmaps_MKL-1.xlsx
→ convert to smallRNA_exceRpt_mapping_summary_MKL-1.csv
If only one file can be submitted, choose exceRpt_biotypeCounts.txt.
If you want full reproducibility, submit both, plus a sample metadata file.
Yes — but you do not necessarily need to submit every intermediate pipeline file.
You should submit the final processed files that are required to reproduce the quantitative results/figures in the manuscript.
By “raw sequencing data” I assume you mean FASTQ/BAM. Files such as *_raw_counts*.txt are already processed data relative to FASTQ, and they are usually expected for GEO/journal submission if they underlie the figures.
Below is a careful breakdown based on the manuscript text.
1. Processed data used in the manuscript that you should consider submitting
| # | Processed data type | Where it is used in the manuscript | Original manuscript sentence / relevant text | Suggested file(s) to submit |
|---|---|---|---|---|
| 1 | RNA-seq gene-level count matrix | Methods 4.10; Results on EV RNA cargo; Fig. 3; Suppl. Fig. S4, S9, S11 | “A total of 40 RNA-seq libraries were processed using the nf-core/rnaseq pipeline…” “Gene-level read counts were generated using featureCounts…” “Raw count data were analyzed using DESeq2.” |
RNAseq_raw_counts_all_samples.txt |
| 2 | RNA-seq normalized / VST-transformed counts | Methods 4.10; heatmaps/PCA/clustering; Fig. 6D; Suppl. Fig. S9 | “For visualization, count data were normalized and variance-stabilized using the variance stabilizing transformation (VST).” | RNAseq_VST_normalized_counts_all_samples.txt or similar |
| 3 | RNA-seq differential abundance tables | Fig. 3B; Fig. 6D; Suppl. Fig. S9; Results on EV vs parental cells and sT knockdown | “Approximately 26,000 transcripts showed a higher relative abundance in EVs, whereas approximately 2,800 transcripts exhibited a lower relative abundance compared with the parental cells.” “Fifteen transcripts showed significantly higher relative abundance following sT knockdown…” |
RNAseq_DESeq2_EV_vs_parental_results.txt RNAseq_DESeq2_sT_knockdown_results.txt |
| 4 | Viral MCPyV transcript counts / normalized abundance | Methods 4.10; Suppl. Fig. S11 | “Sequencing reads were aligned using STAR against a combined reference comprising the human genome (GRCh38) and the corresponding Merkel cell polyomavirus (MCPyV) genome…” Suppl. Fig. S11: “Red dots indicate MCPyV-derived viral transcripts…” |
RNAseq_MCPyV_viral_transcript_counts.txt or include viral rows in the main RNA-seq count table |
| 5 | small RNA-seq miRNA count matrix | Methods 4.11; Fig. 4; Fig. 5; Suppl. Fig. S5, S7 | “Known human miRNAs were annotated according to miRBase, and read counts for individual miRNAs were generated using the COMPSRA pipeline.” “Raw miRNA count data were analyzed using DESeq2.” |
smallRNA_miRNA_counts_all_samples.txt |
| 6 | small RNA-seq normalized miRNA abundance | Fig. 4B; Suppl. Fig. S5B; possibly S7 | Fig. 4B legend: “Manhattan plots showing normalized miRNA abundance(log10 reads per million; RPM)…” | smallRNA_miRNA_RPM_normalized_all_samples.txt or VST/DESeq2-normalized miRNA table |
| 7 | small RNA biotype composition table | Fig. 4A; Suppl. Fig. S5A; Results on small RNA composition | “In parental cells, 59% of mapped reads were annotated as miRNAs…” “In WaGa-derived EVs, 28% of mapped reads were annotated as miRNAs… tRNA-derived reads increased to approximately 29% and piRNA-derived reads accounted for 0.65%.” |
smallRNA_biotype_counts_summary.txt or the source count table used to generate Fig. 4A/S5A |
| 8 | small RNA mapping summary | Results on small RNA mapping; Fig. 4A context | “Approximately 98% of reads obtained from WaGa cells mapped to the human genome, whereas approximately 73% of reads from EVs could be mapped to the human genome.” | smallRNA_mapping_summary.txt |
| 9 | RBP motif enrichment results | Results on RNA-binding protein motifs; Fig. 3 / Fig. S4 | “Analysis of Motif Enrichment(AME) was performed using the ATtRACT database.” “Several significantly enriched sequence motifs and their corresponding RBPs were identified.” |
RNAseq_RBP_motif_enrichment_results.txt |
| 10 | miRNA target network table | Results 2.5; Fig. 5; Suppl. Fig. S6 | “…experimentally validated target genes of the 15 most abundant miRNAs identified in WaGa-derived EVs were retrieved from miRTarBase and used to construct a miRNA-target interaction network.” “The resulting network comprised 196 target genes.” |
miRNA_target_network_nodes.txt miRNA_target_network_edges.txt |
| 11 | Proteomics protein identification and quantification table | Results proteomics; Fig. 2; Fig. 6; Suppl. Fig. S3, S10; Data Availability | “To characterize the protein cargo of WaGa-derived EVs, mass spectrometry was performed, identifying 608 proteins consistently detected across all biological replicates.” “The proteomics data have been deposited with the ProteomeXchange Consortium via the PRIDE partner repository…” |
Proteomics_protein_identifications_quantification.txt optionally peptide-level table |
| 12 | Proteomics differential abundance table | Fig. 6C; Suppl. Fig. S10; Results on sT knockdown proteome | “Differential abundance analysis identified 26 proteins whose abundance was significantly altered following sT knockdown, comprising 24 proteins with higher abundance and 2 proteins with lower abundance in EVs.” | Proteomics_DE Proteins_sT_knockdown_WaGa.txt Proteomics_DE Proteins_sT_knockdown_MKL-1.txt |
2. Do you really need to submit the six files you listed?
| File | My recommendation | Reason |
|---|---|---|
RNAseq_raw_counts_all_samples.txt |
Yes — submit | This is the count matrix used for DESeq2 analysis and underlies Fig. 3, Fig. 6D, Suppl. Fig. S9, and likely Suppl. Fig. S11. The manuscript explicitly says: “Raw count data were analyzed using DESeq2.” |
smallRNA_miRNA_counts_all_samples.txt |
Yes — submit | This is the main small RNA count matrix used for miRNA abundance, differential miRNA analysis, Fig. 4, Fig. 5, Suppl. Fig. S5 and S7. The manuscript explicitly says miRNA read counts were generated and analyzed with DESeq2. |
smallRNA_gencode_counts_all_samples.txt |
Conditional | Submit only if this file was used to generate the small RNA biotype composition shown in Fig. 4A / Suppl. Fig. S5A, e.g. miRNA, tRNA, piRNA, long RNA, etc. The manuscript does not explicitly mention “GENCODE counts”, so it is not automatically required. If this file is only an intermediate file and the biotype percentages were generated from another summary table, you can submit the summary table instead. |
smallRNA_tRNA_counts_all_samples.txt |
Conditional / optional | The manuscript only reports tRNAs as a class: “tRNAs represented 29% of mapped reads…” It does not appear to analyze individual tRNA-derived fragments in detail. If this file is needed to calculate the tRNA percentage in Fig. 4A/S5A, submit it or include it in a combined biotype table. If not, a summarized biotype count table is enough. |
smallRNA_piRNA_counts_all_samples.txt |
Conditional / optional | Same logic as tRNA. The manuscript only reports piRNAs as a percentage: “piRNAs accounted for 0.65%.” If this file is required to reproduce that number, submit it or include it in a biotype summary. Otherwise, individual piRNA counts are not strictly needed unless they are analyzed elsewhere. |
smallRNA_mapping_summary.txt |
Recommended, but not always mandatory | This supports the mapping rates and possibly the biotype composition reported in the manuscript: “Approximately 98% of reads… mapped… whereas approximately 73%…” It is very useful for reproducibility. I would include it as a supplementary processed file or as part of a small RNA QC/summary table. |
3. My practical recommendation for the minimal processed-data package
I would submit the following as the clean, final processed files:
RNA-seq
| File | Needed? | Why |
|---|---|---|
RNAseq_raw_counts_all_samples.txt |
Yes | Underlies DESeq2 analysis |
RNAseq_normalized_counts_all_samples.txt |
Strongly recommended | The manuscript says VST-normalized data were used for visualization |
RNAseq_DESeq2_results_EV_vs_parental.txt |
Yes | Underlies volcano plots / differential RNA cargo |
RNAseq_DESeq2_results_sT_knockdown.txt |
Yes | Underlies Fig. 6D / Suppl. Fig. S9 |
RNAseq_MCPyV_transcript_counts_or_RPM.txt |
Recommended | Needed if Suppl. Fig. S11 is shown |
RNAseq_sample_metadata.txt |
Yes | Needed to understand conditions, replicates, EV vs cells, Dox/DMSO, WaGa/MKL-1 |
small RNA-seq
| File | Needed? | Why |
|---|---|---|
smallRNA_miRNA_counts_all_samples.txt |
Yes | Main miRNA count matrix |
smallRNA_miRNA_RPM_normalized_all_samples.txt |
Strongly recommended | Fig. 4B and Suppl. Fig. S5B show normalized miRNA abundance in RPM |
smallRNA_biotype_counts_summary.txt |
Yes / strongly recommended | Underlies Fig. 4A and Suppl. Fig. S5A |
smallRNA_mapping_summary.txt |
Recommended | Supports mapping rates reported in the text |
smallRNA_DESeq2_miRNA_results.txt |
Yes if differential miRNA analysis is shown | Suppl. Fig. S7 / related text |
smallRNA_sample_metadata.txt |
Yes | Needed to interpret samples |
If you create one clean file called, for example:
smallRNA_biotype_counts_summary.txtwith columns like:
sample
cell_line
sample_type
treatment
total_reads
mapped_reads
miRNA_counts
miRNA_percent
tRNA_counts
tRNA_percent
piRNA_counts
piRNA_percent
longRNA_counts
longRNA_percent
other_counts
other_percent
then you may not need to submit separate smallRNA_tRNA_counts_all_samples.txt and smallRNA_piRNA_counts_all_samples.txt, unless those files are the direct source of the figure.
4. Proteomics: do not forget the processed MS files
The manuscript says:
“The proteomics data have been deposited with the ProteomeXchange Consortium via the PRIDE partner repository under accession number PXDXXXXX.”
And your manuscript notes also say:
“Bente has to do this: Upload processed files (e.g., peptide/protein identifications, quantification tables). Include metadata describing the experimental design.”
So for proteomics, you should submit at least:
| Proteomics processed file | Needed? |
|---|---|
| Protein identification table | Yes |
| Protein quantification table | Yes |
| Peptide identification table | Recommended / often expected by PRIDE |
| Differential protein abundance table for sT knockdown | Yes |
| Sample metadata for MS runs | Yes |
5. Important consistency issues before submission
You should also check these points, because they affect which processed files are correct to submit.
A. Small RNA pipeline inconsistency
In the Results section, the manuscript says:
“Sequencing data were analyzed using the exceRpt pipeline, which is optimized for extracellular RNA analysis.”
But in Methods 4.11, the manuscript says:
“Raw FASTQ files generated by small RNA sequencing were processed using Cutadapt…”
“High-quality reads were aligned… using COMPSRA with the STAR aligner.”
You need to decide which pipeline actually produced the final count files:
- If the final files came from exceRpt, the Methods should mention exceRpt.
- If the final files came from COMPSRA/Cutadapt, remove or correct the exceRpt sentence.
This matters because the submitted processed files must match the described pipeline.
B. Small RNA reference genome inconsistency
Methods 4.11 says:
“…combined reference comprising the human genome (GRCh38) and the Merkel cell polyomavirus genome(JN707599)…”
But for RNA-seq, Methods 4.10 says:
“…combined reference comprising the human genome(GRCh38) and the corresponding Merkel cell polyomavirus(MCPyV) genome(KJ128379.1 for WaGa samples and FJ173815.1 for MKL-1 samples).”
Check whether small RNA-seq really used only JN707599 for all samples, or whether it should match the WaGa/MKL-1 references.
C. Figure 3 panel order
In the Results text, Figure 3C and 3D may not match the Figure legend perfectly. The Results text describes GO enrichment and then RBP motif enrichment, while the Figure legend appears to assign them differently. Before submission, make sure the text, figure panels, and supplementary files match.
Bottom line
For your listed files:
RNAseq_raw_counts_all_samples.txt              → Yes, submit
smallRNA_miRNA_counts_all_samples.txt          → Yes, submit
smallRNA_gencode_counts_all_samples.txt        → Only if used to generate the reported small RNA biotype composition
smallRNA_tRNA_counts_all_samples.txt           → Optional unless needed to reproduce Fig. 4A/S5A
smallRNA_piRNA_counts_all_samples.txt          → Optional unless needed to reproduce Fig. 4A/S5A
smallRNA_mapping_summary.txt                   → Recommended, useful for reproducibility
The safest approach is to submit a clean final processed-data package containing:
- RNA-seq raw counts
- RNA-seq normalized counts / VST
- RNA-seq differential expression tables
- small RNA miRNA raw counts
- small RNA miRNA normalized RPM
- small RNA biotype summary
- small RNA mapping summary
- proteomics protein/peptide identification and quantification tables
- sample metadata for all omics datasets
1. Do You Need to Submit to GEO and Processed Data?
Yes, absolutely. Based on the manuscript’s Data Availability Statement and the email from Nicole Fischer:
| Data Type | Repository | Accession Format |
|---|---|---|
| RNA-seq (total RNA) | NCBI GEO (linked to SRA) | GSEXXXXX / SRXXXXX |
| Small RNA-seq | NCBI GEO (linked to SRA) | GSEXXXXX / SRXXXXX |
| Proteomics (LC-MS/MS) | PRIDE / ProteomeXchange | PXDXXXXX |
What GEO requires:
- Raw data: All
.fastq.gzfiles → uploaded to SRA (Sequence Read Archive) via GEO - Processed data: YES, required. GEO mandates at least one processed data file per sample or a summary matrix. For RNA-seq this means:
- Gene/transcript count matrix (raw counts from featureCounts)
- Optionally: normalized counts (VST/TPM/FPKM)
- For small RNA-seq: miRNA count matrix
- Metadata: Sample attributes, experimental design, platform info, protocols
⚠️ Critical: The email says data must be uploaded but NOT released publicly yet. In GEO you set a future release date (e.g., 1–2 years from now) so you get the accession number immediately but data stays private until manuscript publication.
数据可用性声明
本研究生成的RNA测序(RNA-seq)和小RNA测序(small RNA-seq)数据集已存入基因表达综合数据库(GEO),登录号为GSEXXXXX。蛋白质组学数据已存入ProteomeXchange联盟的PRIDE合作存储库,登录号为PXDXXXXX。
3. Step-by-Step GEO Submission Guide (Einleitung)
Phase 0: Preparation Checklist
Before you start, gather:
| Item | Details |
|---|---|
| NCBI Account | Register at ncbi.nlm.nih.gov/account |
| GEO Account | After NCBI login, request GEO submission access at geo@ncbi.nlm.nih.gov |
| Raw FASTQ files | All .fastq.gz files (RNA-seq + small RNA-seq) |
| Processed data | Count matrices (featureCounts output for RNA-seq; COMPSRA miRNA counts for small RNA-seq) |
| Sample metadata | Cell line, condition, replicate, sample type (EV vs parental cell) |
| Protocol info | Library prep kits, sequencing platform, read length |
Phase 1: Create GEO Submitter Account
- Go to https://www.ncbi.nlm.nih.gov/ → Sign in / Register
- Once logged in, email geo@ncbi.nlm.nih.gov with:
- Subject: “GEO Submitter Account Request”
- Your name, institution, email
- State you want to submit RNA-seq and small RNA-seq data
- Wait for confirmation (usually 1–2 business days). You will receive a GEO submitter login.
Phase 2: Organize Your Samples & Metadata
Based on the manuscript, organize samples into a clear table. Here is the suggested sample organization:
RNA-seq Samples (WaGa)
| Sample Name | Cell Line | Sample Type | Condition | Replicate | File |
|---|---|---|---|---|---|
| WaGa_wt_EV_rep1 | WaGa | EV | untreated (wt) | 1 | 1107_WaGa_wt_EV.fastq.gz |
| WaGa_wt_EV_rep2 | WaGa | EV | untreated (wt) | 2 | 1605_WaGa_wt_EV.fastq.gz |
| WaGa_wt_EV_rep3 | WaGa | EV | untreated (wt) | 3 | 2706_WaGa_wt_EV.fastq.gz |
| WaGa_scr_DMSO_EV_rep1 | WaGa | EV | scr + DMSO | 1 | 1107_WaGa_scr_DMSO_EV.fastq.gz |
| WaGa_scr_Dox_EV_rep1 | WaGa | EV | scr + Dox | 1 | 1107_WaGa_scr_Dox_EV.fastq.gz |
| WaGa_sT_DMSO_EV_rep1 | WaGa | EV | sT + DMSO | 1 | 1107_WaGa_sT_DMSO_EV.fastq.gz |
| WaGa_sT_Dox_EV_rep1 | WaGa | EV | sT + Dox (sT KD) | 1 | 1107_WaGa_sT_Dox_EV.fastq.gz |
| … (rep2, rep3) | |||||
| WaGa_cell_RNA_rep1 | WaGa | Parental cell | untreated | 1 | WaGa_RNA.fastq.gz |
| WaGa_cell_RNA_rep2 | WaGa | Parental cell | untreated | 2 | WaGa_RNA_118.fastq.gz |
| WaGa_cell_RNA_rep3 | WaGa | Parental cell | untreated | 3 | WaGa_RNA_147.fastq.gz |
RNA-seq Samples (MKL-1)
Same structure as WaGa.
Small RNA-seq Samples (WaGa)
Map nf774, nf930–nf939, nf961, nf962, nf971–nf974 to their corresponding conditions. You need to check your lab records to confirm which nf-number corresponds to which sample.
Small RNA-seq Samples (MKL-1)
Map 2404_MKL1_wt_EVs, 2608_*, 2701_*, 2802_*, nf780, nf796, nf797 similarly.
⚠️ Important: The file naming is inconsistent (some have EV suffix, some don’t; some use dates like 042/0505, others use nf-numbers). You must verify the sample-to-file mapping with Ute or your lab notebook before submission.
Phase 3: Start GEO Submission via GEO Submitter Portal
- Log in to the GEO Submitter Portal: https://www.ncbi.nlm.nih.gov/geo/submitter/
- Click “Submit” → Select “High-Throughput Sequencing” (for RNA-seq and small RNA-seq)
- You will create a GEO Series (GSE) that contains:
- BioProject (auto-created)
- BioSample entries (one per biological sample)
- SRA entries (linked FASTQ files)
Phase 4: Fill in the Submission Metadata
4a. Series (GSE) Level
| Field | What to Enter |
|---|---|
| Title | Multi-omics characterization of extracellular vesicles derived from virus-positive Merkel cell carcinoma cells – RNA-seq and small RNA-seq |
| Summary | Copy/adapt from manuscript abstract |
| Overall design | Two MCPyV-positive MCC cell lines (WaGa and MKL-1) with doxycycline-inducible sT knockdown. EVs isolated by differential ultracentrifugation. Total RNA-seq and small RNA-seq of EVs and parental cells under sT knockdown and control conditions. Three biological replicates per condition. |
| Experiment type | RNA-Seq; small RNA-seq |
| Release date | Set to a future date (e.g., 2027-08-01 or later) to keep data private |
4b. BioSample Attributes (per sample)
For each sample, provide:
- organism: Homo sapiens
- cell_line: WaGa or MKL-1
- sample_type: extracellular vesicle / parental cell
- treatment: doxycycline / DMSO / untreated
- genotype: shRNA-sT / shRNA-scramble / wild-type
- molecule: total RNA / small RNA
- source_name: e.g., “WaGa EV sT knockdown replicate 1”
4c. SRA / Platform Info
| Field | Value |
|---|---|
| Instrument | Illumina NextSeq 500 |
| Read length | 75 bp single-end |
| Library strategy | RNA-Seq / miRNA-Seq |
| Library source | transcriptomic |
| Library selection | cDNA / size fractionation (small RNA) |
| Library kit | CORALL Total RNA-Seq V2 Kit / LEXOGEN Small RNA-Seq Library Prep Kit |
Phase 5: Upload Raw FASTQ Files
- GEO submission will direct you to upload files to SRA via FTP or Aspera
- You will receive an FTP upload folder (e.g.,
ftp://ftp-private.ncbi.nlm.nih.gov/uploads/geo/...) - Upload all
.fastq.gzfiles:
# Example using FTP (you can also use Aspera or web browser)
# Connect to the FTP server provided by GEO
ftp ftp-private.ncbi.nlm.nih.gov
# Login with provided credentials
cd uploads/geo/your_folder/

# Upload WaGa RNA-seq
put Data_RNA-Seq_WaGa/1107_WaGa_wt_EV.fastq.gz
put Data_RNA-Seq_WaGa/1107_WaGa_scr_DMSO_EV.fastq.gz
# ... repeat for all files

# Upload small RNA-seq
put Data_smallRNA_WaGa/nf774.fastq.gz
# ... repeat for all files
Or use Aspera (faster for large files):
ascp -k 1 -T -l 300m \
  Data_RNA-Seq_WaGa/*.fastq.gz \
  subasp@upload.ncbi.nlm.nih.gov:uploads/geo/your_folder/RNASeq_WaGa/

ascp -k 1 -T -l 300m \
  Data_smallRNA_WaGa/*.fastq.gz \
  subasp@upload.ncbi.nlm.nih.gov:uploads/geo/your_folder/smallRNA_WaGa/
Phase 6: Upload Processed Data
GEO requires processed data. Prepare:
-
RNA-seq count matrix (from featureCounts):
- A tab-delimited file: rows = genes, columns = samples
- Raw counts (not normalized)
-
Small RNA-seq miRNA count matrix (from COMPSRA):
- A tab-delimited file: rows = miRNAs, columns = samples
-
Upload these as supplementary files in the GEO submission portal:
- Format:
.txtor.csv(tab-delimited) - Label clearly: e.g.,
WaGa_MKL1_RNAseq_raw_counts.txt,WaGa_MKL1_smallRNA_miRNA_counts.txt
- Format:
Phase 7: Review and Submit
- Review all metadata, sample descriptions, and file assignments
- Set the release date to a future date (this keeps data private)
- Click Submit
- You will receive:
- GSE accession number (e.g., GSE123456) → put this in the manuscript
- SRA accession numbers for individual samples
- A token for reviewer access (optional, for peer review)
Phase 8: Update the Manuscript
Replace GSEXXXXX in the Data Availability Statement with the actual GSE number:
“The RNA sequencing (RNA-seq) and small RNA sequencing (small RNA-seq) datasets generated in this study have been deposited in the Gene Expression Omnibus (GEO) under accession number GSE[ACTUAL NUMBER].”
Quick Checklist Summary
| Step | Action | Status |
|---|---|---|
| ☐ 1 | Register NCBI + GEO account | |
| ☐ 2 | Verify sample-to-file mapping (especially nf-numbers!) | |
| ☐ 3 | Prepare metadata spreadsheet | |
| ☐ 4 | Generate processed count matrices | |
| ☐ 5 | Start GEO submission (High-Throughput Sequencing) | |
| ☐ 6 | Fill in Series, BioSample, SRA metadata | |
| ☐ 7 | Upload FASTQ files via FTP/Aspera | |
| ☐ 8 | Upload processed data files | |
| ☐ 9 | Set future release date (NOT public) | |
| ☐ 10 | Submit → receive GSE accession number | |
| ☐ 11 | Send GSE number to Nicole/Ute for manuscript |
💡 Tip: The proteomics data (PRIDE/ProteomeXchange) is a separate submission handled by the mass spectrometry team (Bente Siebels). You only need to handle the RNA-seq and small RNA-seq GEO submission.