-
Environment Setup: It sets up a Conda environment named picrust2, using the conda create command and then activates this environment using conda activate picrust2.
 #https://github.com/picrust/picrust2/wiki/PICRUSt2-Tutorial-(v2.2.0-beta)#minimum-requirements-to-run-full-tutorial
 mamba create -n picrust2 -c bioconda -c conda-forge picrust2    #2.5.3  #=2.2.0_b
 mamba activate /home/jhuang/miniconda3/envs/picrust2
Under docker-env (qiime2-amplicon-2023.9)
-
Export QIIME2 feature table and representative sequences
#docker pull quay.io/qiime2/core:2023.9 #docker run -it --rm \ #-v /mnt/md1/DATA/Data_Karoline_16S_2025:/data \ #-v /home/jhuang/REFs:/home/jhuang/REFs \ #quay.io/qiime2/core:2023.9 bash #cd /data # === SETTINGS === FEATURE_TABLE_QZA="dada2_tests2/test_7_f240_r240/table.qza" REP_SEQS_QZA="dada2_tests2/test_7_f240_r240/rep-seqs.qza" # === STEP 1: EXPORT QIIME2 ARTIFACTS === mkdir -p qiime2_export qiime tools export --input-path $FEATURE_TABLE_QZA --output-path qiime2_export qiime tools export --input-path $REP_SEQS_QZA --output-path qiime2_export -
Convert BIOM to TSV for Picrust2 input
 biom convert \
 -i qiime2_export/feature-table.biom \
 -o qiime2_export/feature-table.tsv \
 --to-tsv
Under env (picrust2): mamba activate /home/jhuang/miniconda3/envs/picrust2
-
Run PICRUSt2 pipeline
tail -n +2 qiime2_export/feature-table.tsv > qiime2_export/feature-table-fixed.tsv picrust2_pipeline.py \ -s qiime2_export/dna-sequences.fasta \ -i qiime2_export/feature-table-fixed.tsv \ -o picrust2_out \ -p 100 #This will: #* Place sequences in the reference tree (using EPA-NG), #* Predict gene family abundances (e.g., EC, KO, PFAM, TIGRFAM), #* Predict pathway abundances. #In current PICRUSt2 (with picrust2_pipeline.py), you do not run hsp.py separately. #Instead, picrust2_pipeline.py internally runs the HSP step for all functional categories automatically. It outputs all the prediction files (16S_predicted_and_nsti.tsv.gz, COG_predicted.tsv.gz, PFAM_predicted.tsv.gz, KO_predicted.tsv.gz, EC_predicted.tsv.gz, TIGRFAM_predicted.tsv.gz, PHENO_predicted.tsv.gz) in the output directory. mkdir picrust2_out_advanced; cd picrust2_out_advanced #If you still want to run hsp.py manually (advanced use / debugging), the commands correspond directly: hsp.py -i 16S -t ../picrust2_out/out.tre -o 16S_predicted_and_nsti.tsv.gz -p 100 -n hsp.py -i COG -t ../picrust2_out/out.tre -o COG_predicted.tsv.gz -p 100 hsp.py -i PFAM -t ../picrust2_out/out.tre -o PFAM_predicted.tsv.gz -p 100 hsp.py -i KO -t ../picrust2_out/out.tre -o KO_predicted.tsv.gz -p 100 hsp.py -i EC -t ../picrust2_out/out.tre -o EC_predicted.tsv.gz -p 100 hsp.py -i TIGRFAM -t ../picrust2_out/out.tre -o TIGRFAM_predicted.tsv.gz -p 100 hsp.py -i PHENO -t ../picrust2_out/out.tre -o PHENO_predicted.tsv.gz -p 100 -
Metagenome prediction per functional category (if needed separately)
#cd picrust2_out_advanced metagenome_pipeline.py -i ../qiime2_export/feature-table.biom -m 16S_predicted_and_nsti.tsv.gz -f COG_predicted.tsv.gz -o COG_metagenome_out --strat_out metagenome_pipeline.py -i ../qiime2_export/feature-table.biom -m 16S_predicted_and_nsti.tsv.gz -f EC_predicted.tsv.gz -o EC_metagenome_out --strat_out metagenome_pipeline.py -i ../qiime2_export/feature-table.biom -m 16S_predicted_and_nsti.tsv.gz -f KO_predicted.tsv.gz -o KO_metagenome_out --strat_out metagenome_pipeline.py -i ../qiime2_export/feature-table.biom -m 16S_predicted_and_nsti.tsv.gz -f PFAM_predicted.tsv.gz -o PFAM_metagenome_out --strat_out metagenome_pipeline.py -i ../qiime2_export/feature-table.biom -m 16S_predicted_and_nsti.tsv.gz -f TIGRFAM_predicted.tsv.gz -o TIGRFAM_metagenome_out --strat_out # Add descriptions in gene family tables add_descriptions.py -i COG_metagenome_out/pred_metagenome_unstrat.tsv.gz -m COG -o COG_metagenome_out/pred_metagenome_unstrat_descrip.tsv.gz add_descriptions.py -i EC_metagenome_out/pred_metagenome_unstrat.tsv.gz -m EC -o EC_metagenome_out/pred_metagenome_unstrat_descrip.tsv.gz add_descriptions.py -i KO_metagenome_out/pred_metagenome_unstrat.tsv.gz -m KO -o KO_metagenome_out/pred_metagenome_unstrat_descrip.tsv.gz # EC and METACYC is a pair, EC for gene_annotation and METACYC for pathway_annotation add_descriptions.py -i PFAM_metagenome_out/pred_metagenome_unstrat.tsv.gz -m PFAM -o PFAM_metagenome_out/pred_metagenome_unstrat_descrip.tsv.gz add_descriptions.py -i TIGRFAM_metagenome_out/pred_metagenome_unstrat.tsv.gz -m TIGRFAM -o TIGRFAM_metagenome_out/pred_metagenome_unstrat_descrip.tsv.gz -
Pathway inference (MetaCyc pathways from EC numbers)
#cd picrust2_out_advanced pathway_pipeline.py -i EC_metagenome_out/pred_metagenome_contrib.tsv.gz -o EC_pathways_out -p 100 pathway_pipeline.py -i EC_metagenome_out/pred_metagenome_unstrat.tsv.gz -o EC_pathways_out_per_seq -p 100 --per_sequence_contrib --per_sequence_abun EC_metagenome_out/seqtab_norm.tsv.gz --per_sequence_function EC_predicted.tsv.gz #ERROR due to missing .../pathway_mapfiles/KEGG_pathways_to_KO.tsv pathway_pipeline.py -i COG_metagenome_out/pred_metagenome_contrib.tsv.gz -o KEGG_pathways_out -p 100 --no_regroup --map /home/jhuang/anaconda3/envs/picrust2/lib/python3.6/site-packages/picrust2/default_files/pathway_mapfiles/KEGG_pathways_to_KO.tsv pathway_pipeline.py -i KO_metagenome_out/pred_metagenome_strat.tsv.gz -o KEGG_pathways_out -p 100 --no_regroup --map /home/jhuang/anaconda3/envs/picrust2/lib/python3.6/site-packages/picrust2/default_files/pathway_mapfiles/KEGG_pathways_to_KO.tsv add_descriptions.py -i EC_pathways_out/path_abun_unstrat.tsv.gz -m METACYC -o EC_pathways_out/path_abun_unstrat_descrip.tsv.gz gunzip EC_pathways_out/path_abun_unstrat_descrip.tsv.gz #Error - no rows remain after regrouping input table. The default pathway and regroup mapfiles are meant for EC numbers. Note that KEGG pathways are not supported since KEGG is a closed-source database, but you can input custom pathway mapfiles if you have access. If you are using a custom function database did you mean to set the --no-regroup flag and/or change the default pathways mapfile used? #If ERROR --> USE the METACYC for downstream analyses!!! #ERROR due to missing .../description_mapfiles/KEGG_pathways_info.tsv.gz #add_descriptions.py -i KO_pathways_out/path_abun_unstrat.tsv.gz -o KEGG_pathways_out/path_abun_unstrat_descrip.tsv.gz --custom_map_table /home/jhuang/anaconda3/envs/picrust2/lib/python3.6/site-packages/picrust2/default_files/description_mapfiles/KEGG_pathways_info.tsv.gz #NOTE: Target-analysis for the pathway "mixed acid fermentation" -
Visualization
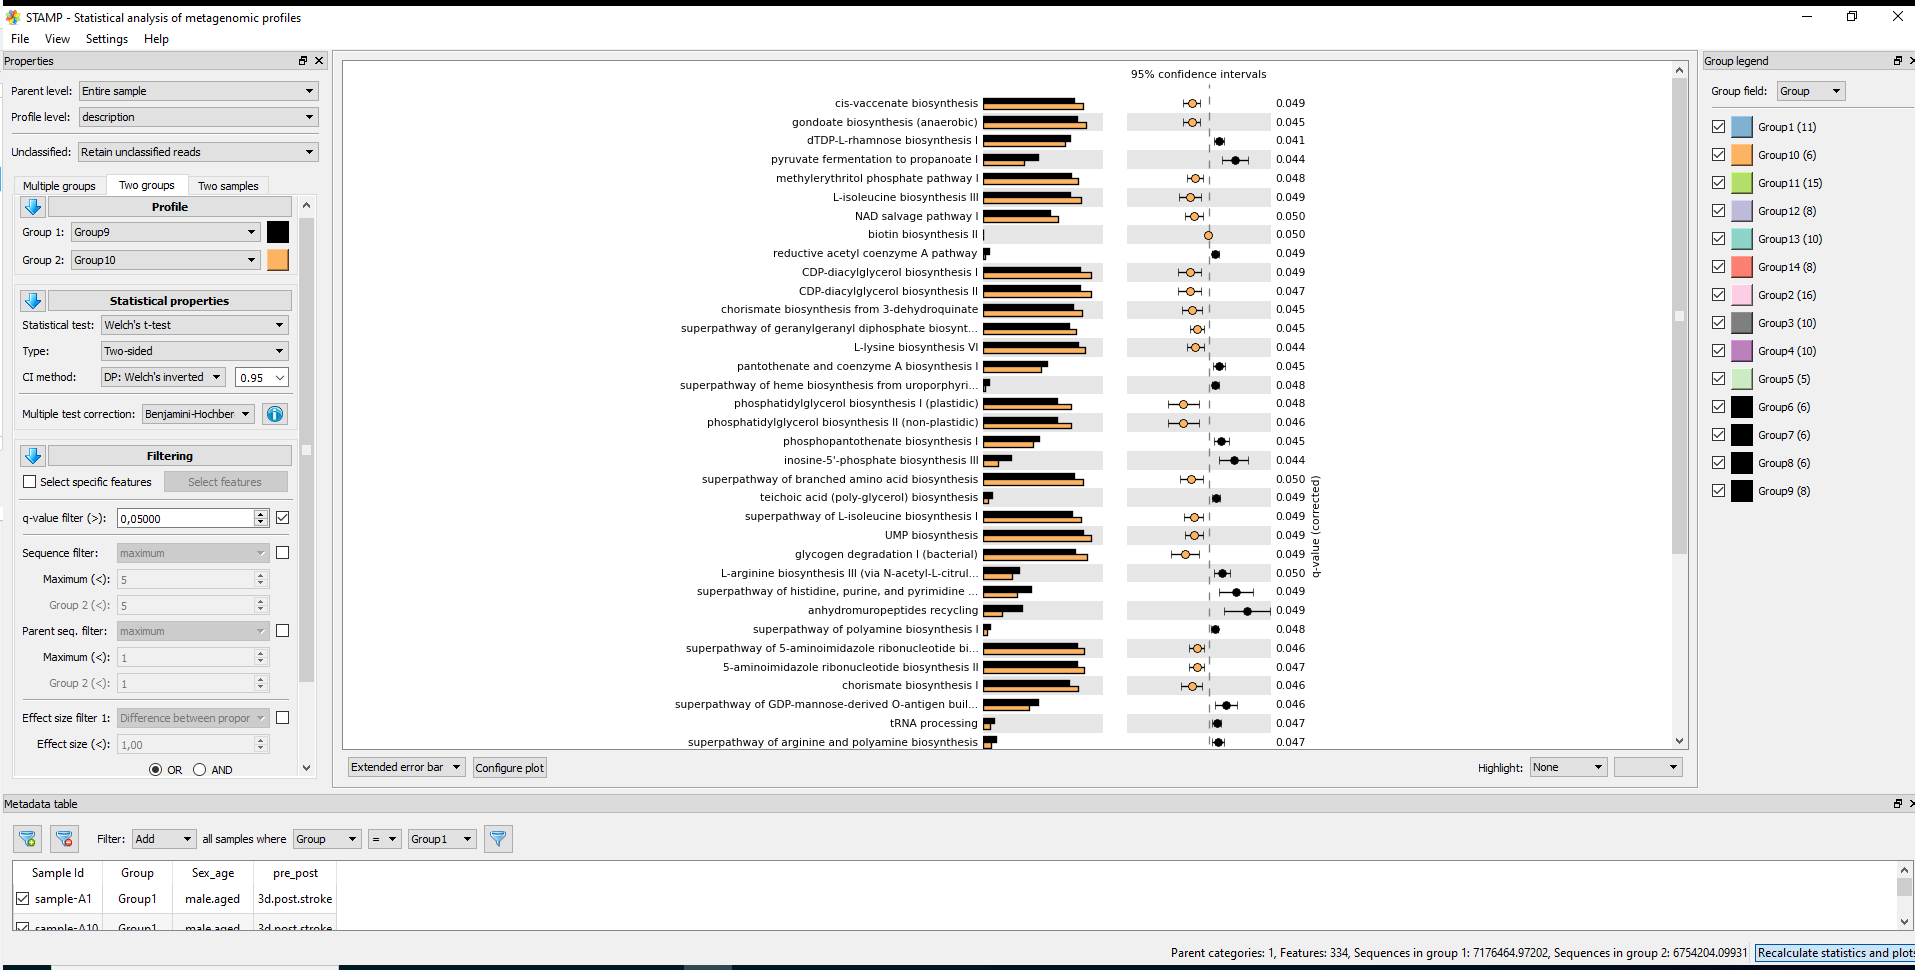
 #7.1 STAMP
 #https://github.com/picrust/picrust2/wiki/STAMP-example
 #Note that STAMP can only be opened under Windows

 # It needs two files: path_abun_unstrat_descrip.tsv.gz as "Profile file" and metadata.tsv as "Group metadata file".
 cp ~/DATA/Data_Karoline_16S_2025/picrust2_out_advanced/EC_pathways_out/path_abun_unstrat_descrip.tsv ~/DATA/Access_to_Win10/

 cut -d$'\t' -f1 qiime2_metadata.tsv > 1
 cut -d$'\t' -f3 qiime2_metadata.tsv > 3
 cut -d$'\t' -f5-6 qiime2_metadata.tsv > 5_6
 paste -d$'\t' 1 3 > 1_3
 paste -d$'\t' 1_3 5_6 > metadata.tsv
 #SampleID --> SampleID
 SampleID        Group   pre_post        Sex_age
 sample-A1       Group1  3d.post.stroke  male.aged
 sample-A2       Group1  3d.post.stroke  male.aged
 sample-A3       Group1  3d.post.stroke  male.aged
 cp ~/DATA/Data_Karoline_16S_2025/metadata.tsv ~/DATA/Access_to_Win10/
 # MANULLY_EDITING: keeping the only needed records in metadata.tsv: Group 9 (J1–J4, J10, J11) and Group 10 (K1–K6).

 #7.2. ALDEx2
 https://bioconductor.org/packages/release/bioc/html/ALDEx2.html
Under docker-env (qiime2-amplicon-2023.9)
-
(NOT_NEEDED) Convert pathway output to BIOM and re-import to QIIME2 gunzip picrust2_out/pathways_out/path_abun_unstrat.tsv.gz biom convert \ -i picrust2_out/pathways_out/path_abun_unstrat.tsv \ -o picrust2_out/path_abun_unstrat.biom \ –table-type=”Pathway table” \ –to-hdf5
qiime tools import \ --input-path picrust2_out/path_abun_unstrat.biom \ --type 'FeatureTable[Frequency]' \ --input-format BIOMV210Format \ --output-path path_abun.qza #qiime tools export --input-path path_abun.qza --output-path exported_path_abun #qiime tools peek path_abun.qza echo "✅ PICRUSt2 pipeline complete. Output in: picrust2_out" -
Short answer: unless you had a very clear, pre-specified directional hypothesis, you should use a two-sided test.
A bit more detail: * Two-sided t-test * Tests: “Are the means different?” (could be higher or lower). * Standard default in most biological and clinical studies and usually what reviewers expect. * More conservative than a one-sided test. * One-sided t-test * Tests: “Is Group A greater than Group B?” (or strictly less than). * You should only use it if before looking at the data you had a strong reason to expect a specific direction and you would ignore/consider uninterpretable a difference in the opposite direction. * Using one-sided just to gain significance is considered bad practice. For your pathway analysis (exploratory, many pathways, q-value correction), the safest and most defensible choice is to: * Use a two-sided t-test (equal variance or Welch’s, depending on variance assumptions). So I’d recommend rerunning STAMP with Type: Two-sided and reporting those results. #--> Using a two-sided Welch's t-test in STAMP, that is the unequal-variance version (does not assume equal variances and is more conservative than “t-test (equal variance)” referring to the classical unpaired Student’s t-test. -
Statistics in STAMP
* For multiple groups: * Statistical test: ANOVA, Kruskal-Wallis H-test * Post-hoc test: Games-Howell, Scheffe, Tukey-Kramer, Welch's (uncorrected) (by default 0.95) * Effect size: Eta-squared * Multiple test correction: Benjamini-Hochberg FDR, Bonferroni, No correction * For two groups * Statistical test: t-test (equal variance), Welch's t-test, White's non-parametric t-test * Type: One-sided, Two-sided * CI method: "DP: Welch's inverted" (by default 0.95) * Multiple test correction: Benjamini-Hochberg FDR, Bonferroni, No correction, Sidak, Storey FDR * For two samples * Statistical test: Bootstrap, Chi-square test, Chi-square test (w/Yates'), Difference between proportions, Fisher's exact test, G-test, G-test (w/Yates'), G-test (w/Yates') + Fisher's, Hypergeometric, Permutation * Type: One-sided, Two-sided * CI method: "DP: Asymptotic", "DP: Asymptotic-CC", "DP: Newcomber-Wilson", "DR: Haldane adjustment", "RP: Asymptotic" (by default 0.95) * Multiple test correction: Benjamini-Hochberg FDR, Bonferroni, No correction, Sidak, Storey FDR -
Since MetaCyc does not have a single pathway explicitly named “short-chain fatty acid biosynthesis”, I defined a small SCFA-related set (acetate-, propionate- and butyrate-producing pathways) and tested these between Group 9 and Group 10 (Welch’s t-test, with BH correction within this subset). These pathways can also be found in the file Welchs_t-test.xlsx attached to my email from 26.11.2025 (for Group9 (J1-4, J6-7, J10-11) vs Group10 (K1-6)).
Pathway ID  Description     Group 9 mean (%)    Group 10 mean (%)   p-value     p-adj (BH, SCFA set)
P108-PWY    pyruvate fermentation to propanoate I   0.5070  0.3817  0.001178    0.0071
PWY-5100    pyruvate fermentation to acetate and lactate II     0.8354  0.9687  0.007596    0.0228
CENTFERM-PWY    pyruvate fermentation to butanoate  0.0766  0.0410  0.026608    0.0532
PWY-5677    succinate fermentation to butanoate     0.0065  0.0088  0.365051    0.5476
P163-PWY    L-lysine fermentation to acetate and butanoate  0.0324  0.0271  0.484704    0.5816
PWY-5676    acetyl-CoA fermentation to butanoate II     0.1397  0.1441  0.927588    0.9276
In this SCFA-focused set, the propionate (P108-PWY) and acetate (PWY-5100) pathways remain significantly different between Group 9 and Group 10 after adjustment, whereas the butyrate-related pathways do not show clear significant differences (CENTFERM-PWY is borderline).
from 14.01.2026 (for Group9 (J1-4, J10-11) vs Group10 (K1-6)), marked green in the Excel-files.
Pathway ID  Description Group 9 mean (%)    Group 10 mean (%)   p-value p-adj (BH, 6-pathway set)
P108-PWY    pyruvate fermentation to propanoate I   0.5142  0.3817  0.001354    0.008127
PWY-5100    pyruvate fermentation to acetate and lactate II 0.8401  0.9687  0.008763    0.026290
CENTFERM-PWY    pyruvate fermentation to butanoate  0.0729  0.0410  0.069958    0.139916
PWY-5677    succinate fermentation to butanoate 0.0063  0.0088  0.367586    0.551379
P163-PWY    L-lysine fermentation to acetate and butanoate  0.0308  0.0271  0.693841    0.832609
PWY-5676 acetyl-CoA fermentation to butanoate II 0.1421 0.1441 0.971290 0.971290-
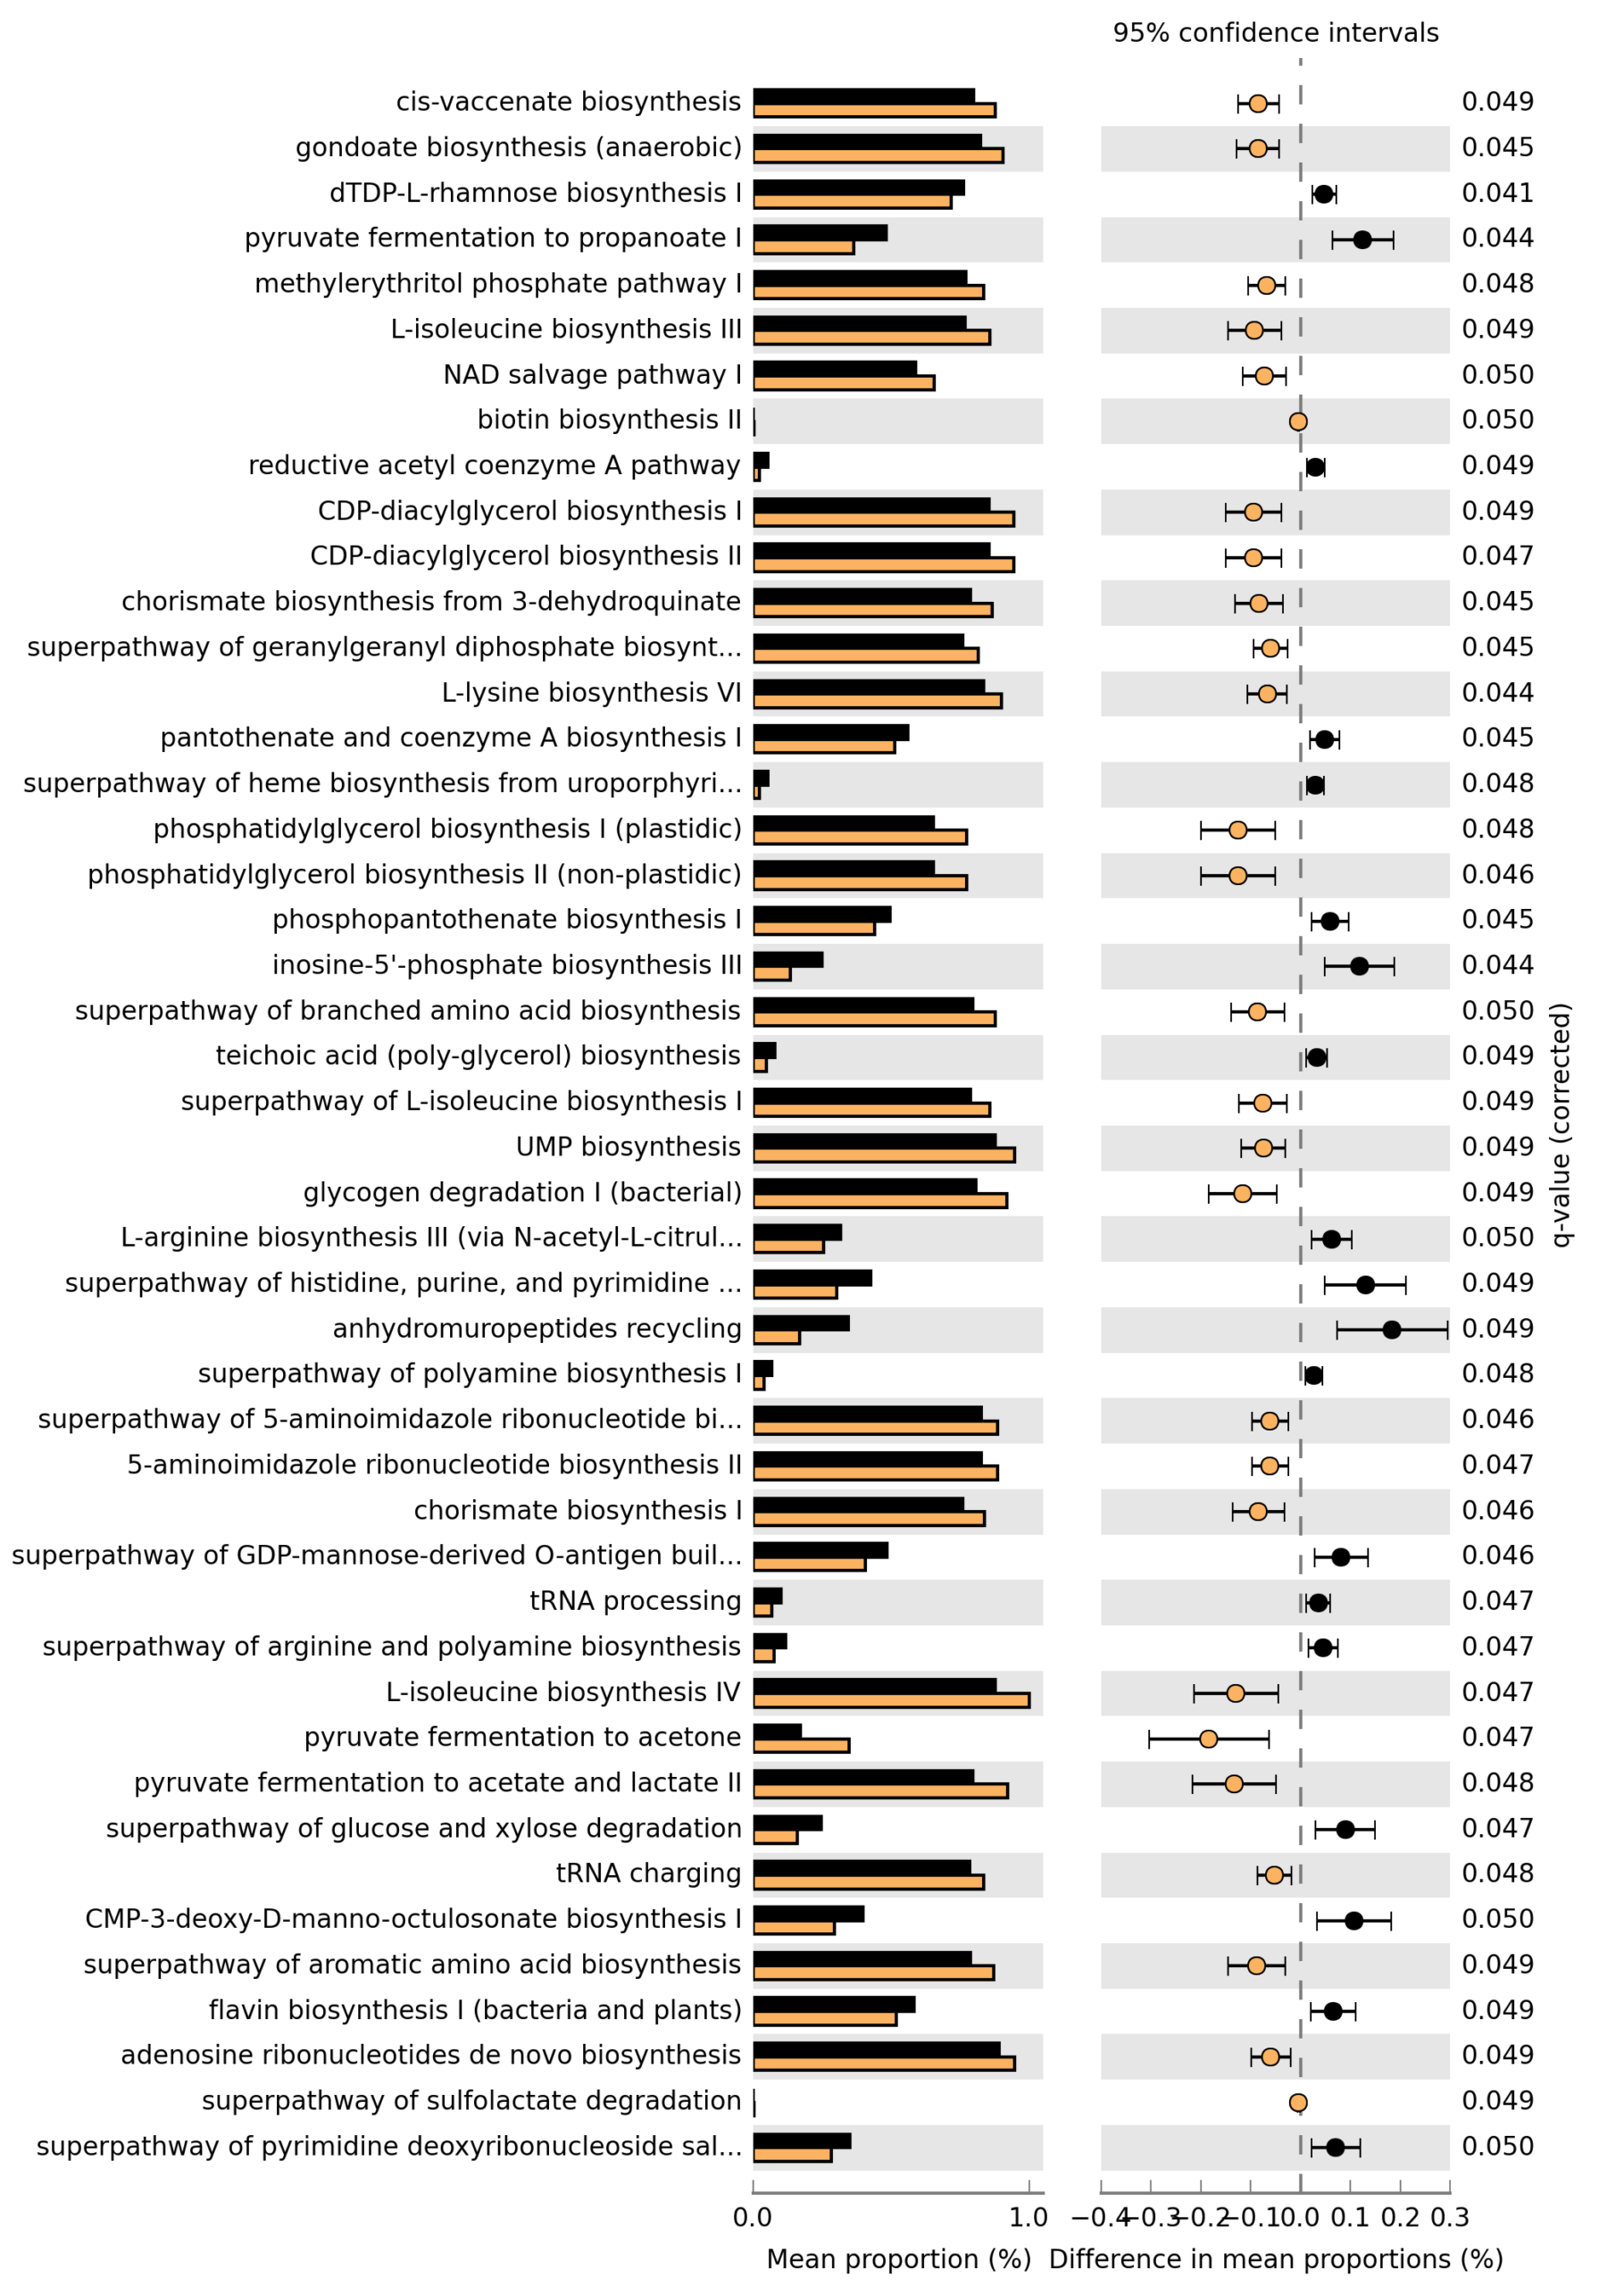
Reporting
Please find attached the results of the pathway analysis. The Excel file contains the full statistics for all pathways; those with adjusted p-values (Benjamini–Hochberg) ≤ 0.05 are highlighted in yellow and are the ones illustrated in the figure.

The analysis was performed using Welch’s t-test (two-sided) with Benjamini–Hochberg correction for multiple testing.