    #Set the comparison condition in the R-script
    comparison <- "Moxi_18h_vs_Untreated_18h"
    # e.g.
    # comparison <- "Mitomycin_18h_vs_Untreated_18h"
    # comparison <- "Mitomycin_8h_vs_Untreated_8h"
    # comparison <- "Moxi_8h_vs_Untreated_8h"
    # comparison <- "Mitomycin_4h_vs_Untreated_4h"
    # comparison <- "Moxi_4h_vs_Untreated_4h"
    (r_env) Rscript make_circos_from_deseq.R

    (circos-env) cd circos_Moxi_18h_vs_Untreated_18h
    (circos-env) touch karyotype.txt (see the step2)
    (circos-env) touch circos.conf (see the step3)
    cp circos_Moxi_18h_vs_Untreated_18h/karyotype.txt circos_Moxi_8h_vs_Untreated_8h/
    cp circos_Moxi_18h_vs_Untreated_18h/karyotype.txt circos_Moxi_4h_vs_Untreated_4h/
    cp circos_Moxi_18h_vs_Untreated_18h/karyotype.txt circos_Mitomycin_18h_vs_Untreated_18h/
    cp circos_Moxi_18h_vs_Untreated_18h/karyotype.txt circos_Mitomycin_8h_vs_Untreated_8h/
    cp circos_Moxi_18h_vs_Untreated_18h/karyotype.txt circos_Mitomycin_4h_vs_Untreated_4h/
    cp circos_Moxi_18h_vs_Untreated_18h/circos.conf circos_Moxi_8h_vs_Untreated_8h/
    cp circos_Moxi_18h_vs_Untreated_18h/circos.conf circos_Moxi_4h_vs_Untreated_4h/
    cp circos_Moxi_18h_vs_Untreated_18h/circos.conf circos_Mitomycin_18h_vs_Untreated_18h/
    cp circos_Moxi_18h_vs_Untreated_18h/circos.conf circos_Mitomycin_8h_vs_Untreated_8h/
    cp circos_Moxi_18h_vs_Untreated_18h/circos.conf circos_Mitomycin_4h_vs_Untreated_4h/

    (circos-env) circos -conf circos.conf
    #or (circos-env) /home/jhuang/mambaforge/envs/circos-env/bin/circos  -conf /mnt/md1/DATA/Data_JuliaFuchs_RNAseq_2025/results/star_salmon/degenes/circos/circos.conf

    #(circos-env) jhuang@WS-2290C:/mnt/md1/DATA/Data_JuliaFuchs_RNAseq_2025/results/star_salmon/degenes$ find . -name "*circos.png"
    mv ./circos_Moxi_4h_vs_Untreated_4h/circos.png circos_Moxi_4h_vs_Untreated_4h.png
    mv ./circos_Moxi_18h_vs_Untreated_18h/circos.png circos_Moxi_18h_vs_Untreated_18h.png
    mv ./circos_Moxi_8h_vs_Untreated_8h/circos.png circos_Moxi_8h_vs_Untreated_8h.png
    mv ./circos_Mitomycin_18h_vs_Untreated_18h/circos.png circos_Mitomycin_18h_vs_Untreated_18h.png
    mv ./circos_Mitomycin_8h_vs_Untreated_8h/circos.png circos_Mitomycin_8h_vs_Untreated_8h.png
    mv ./circos_Mitomycin_4h_vs_Untreated_4h/circos.png circos_Mitomycin_4h_vs_Untreated_4h.png
- touch karyotype.txt
chr - CP052959.1 CP052959.1 0 2706926 grey- touch circos.conf
karyotype = karyotype.txt
<ideogram>
<spacing>
default = 0.005r
</spacing>
radius = 0.80r
thickness = 20p
fill = yes
show_label = yes
label_radius = 1.05r
label_size = 30p
label_font = bold
label_parallel = yes
</ideogram>
# --- Wichtig: Schalter auf Top-Level, NICHT im
<ticks>-Block ---
show_ticks = yes
show_tick_labels = yes
<ticks>
# Starte direkt an der äußeren Ideogramm-Kante
radius = dims(ideogram,radius_outer)
orientation = out # Ticks nach außen zeichnen (oder 'in' für nach innen)
color = black
thickness = 2p
size = 8p
# kleine Ticks alle 100 kb, ohne Label
<tick>
spacing = 50000
size = 8p
thickness = 3p
color = black
show_label = no
</tick>
# große Ticks alle 500 kb, mit Label in Mb
<tick>
spacing = 100000
size = 12p
thickness = 5p
color = black
show_label = yes
label_size = 18p
label_offset = 6p
multiplier = 0.000001 # in Mb
format = %.1f
suffix = " Mb"
</tick>
</ticks>
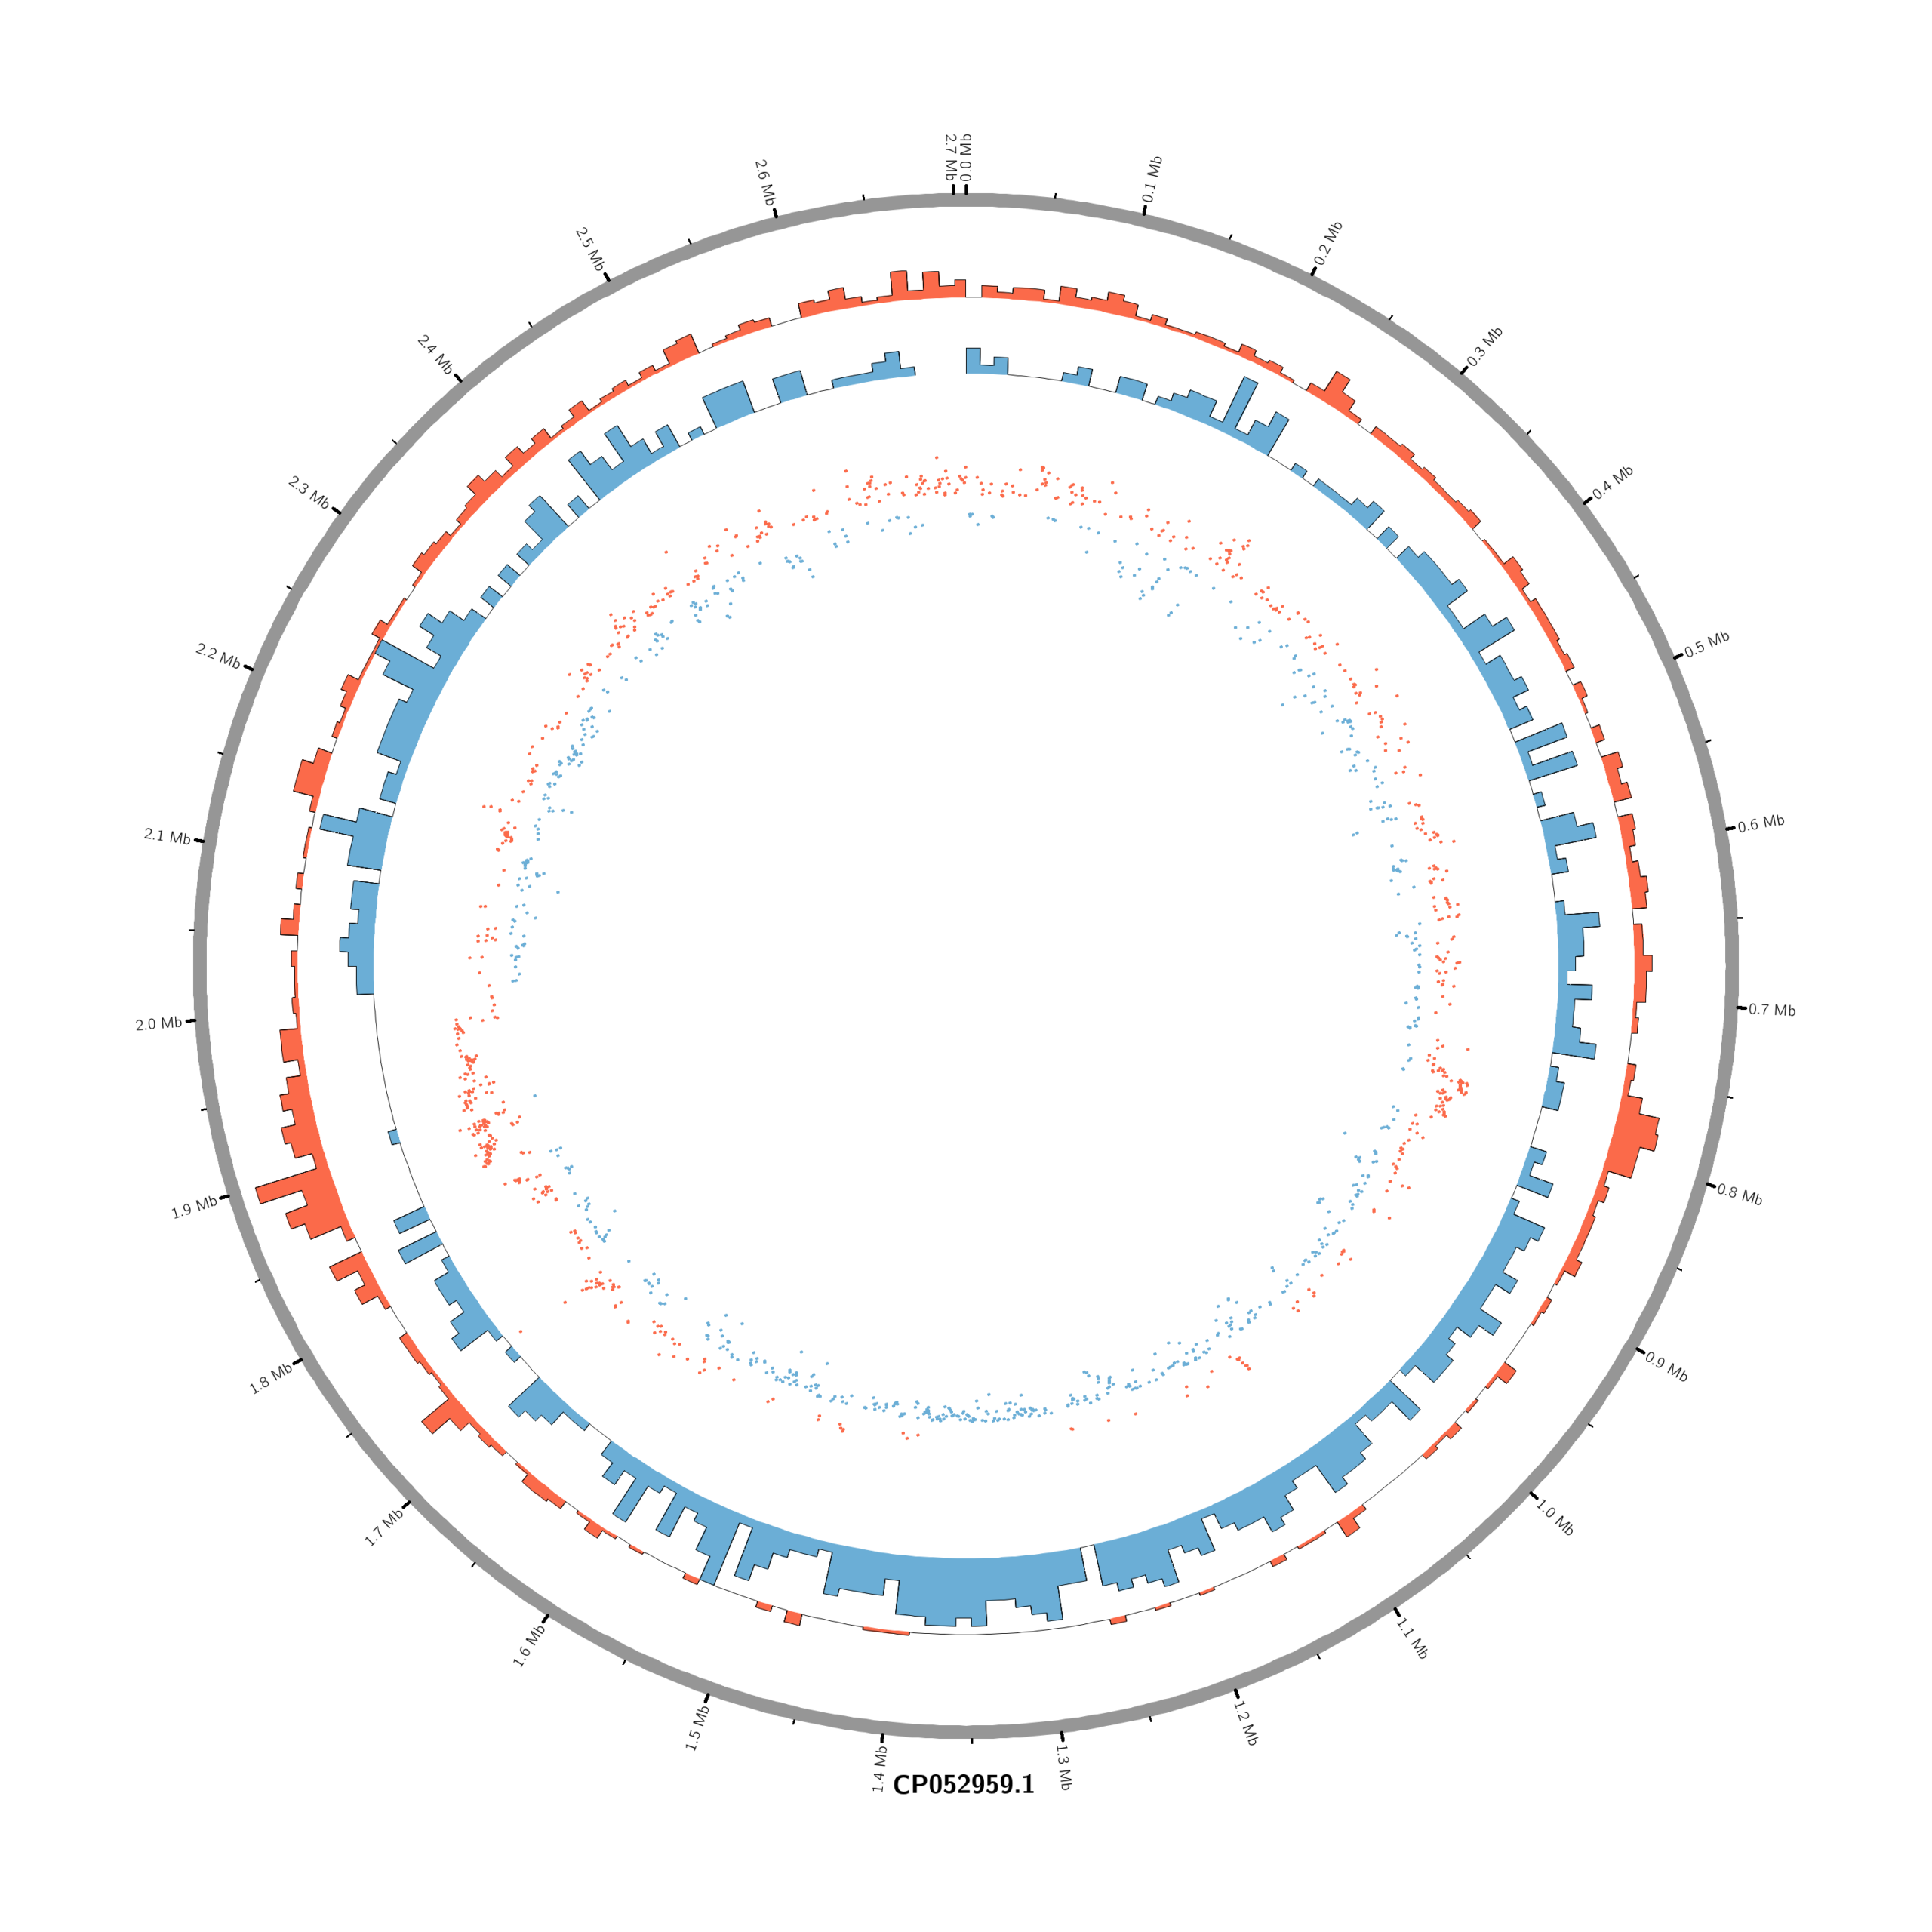
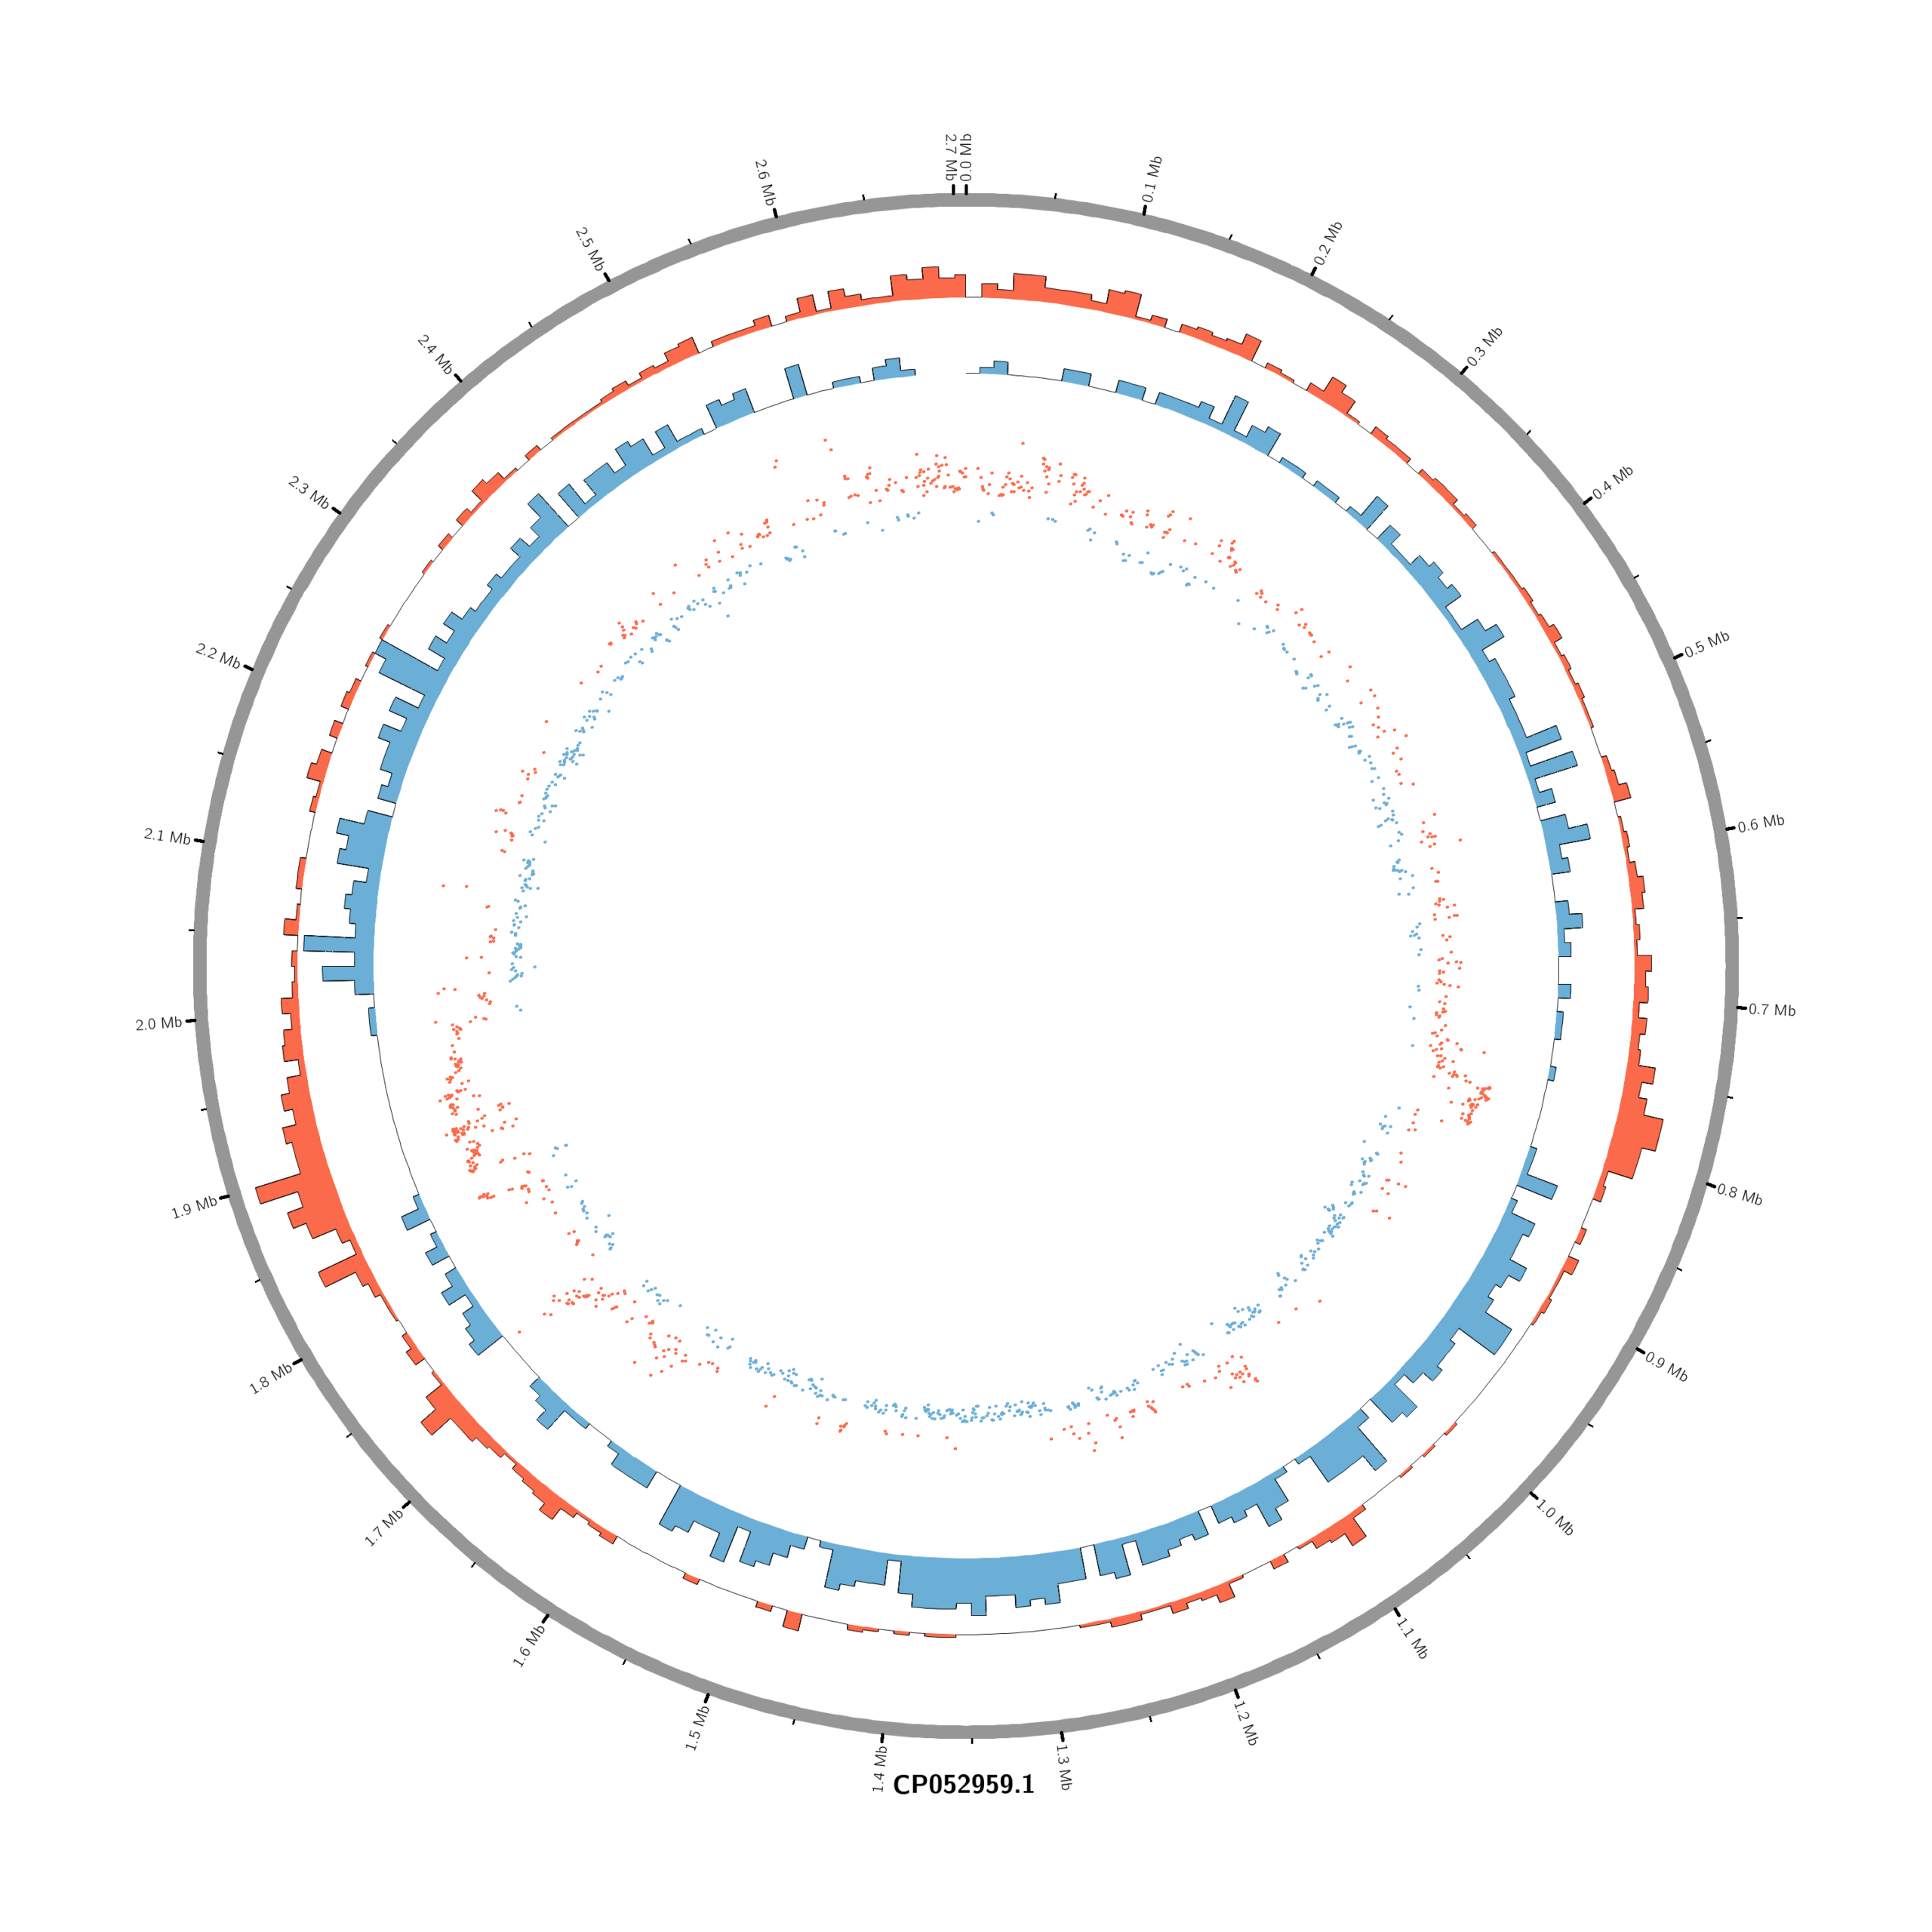
<plots>
# Density of up-regulated genes
<plot>
show = yes
type = histogram
file = data/density_up.txt
r0 = 0.88r
r1 = 0.78r
fill_color = red
thickness = 1p
</plot>
# Density of down-regulated genes
<plot>
show = yes
type = histogram
file = data/density_down.txt
r0 = 0.78r
r1 = 0.68r
fill_color = blue
thickness = 1p
</plot>
# Scatter of individual significantly DE genes
<plot>
show = yes
type = scatter
file = data/genes_scatter.txt
r0 = 0.46r
r1 = 0.76r
glyph = circle
glyph_size = 5p
stroke_thickness = 0
min = -15
max = 15
<rules>
<rule>
condition = var(value) > 0
color = red
</rule>
<rule>
condition = var(value) < 0
color = blue
</rule>
</rules>
</plot>
</plots>
<image>
<<include etc/image.conf>>
</image>
<<include etc/colors_fonts_patterns.conf>>
<<include etc/housekeeping.conf>>-
Rscript make_circos_from_deseq.R
 ############################################################
 # make_circos_from_deseq.R
 #
 # - Read DESeq2 results (annotated CSV)
 # - Read BED annotation
 # - Merge by GeneID
 # - Classify genes (up / down / ns)
 # - Create Circos input files:
 #     * genes_scatter.txt
 #     * density_up.txt
 #     * density_down.txt
 # - Create annotated versions of the above
 # - Export annotated tables into one Excel workbook
 ############################################################

 ###############################
 # 0. Single parameter to set
 ###############################

 # Just change this line for each comparison:
 #comparison <- "Moxi_18h_vs_Untreated_18h"
 # e.g.
 #comparison <- "Mitomycin_18h_vs_Untreated_18h"
 #comparison <- "Mitomycin_8h_vs_Untreated_8h"
 #comparison <- "Moxi_8h_vs_Untreated_8h"
 #comparison <- "Mitomycin_4h_vs_Untreated_4h"
 comparison <- "Moxi_4h_vs_Untreated_4h"

 ###############################
 # 0. Derived settings
 ###############################

 # DESeq2 result file (annotated)
 deseq_file <- paste0(comparison, "-all_annotated.csv")

 # BED file with gene coordinates (constant for this genome)
 bed_file   <- "CP052959_m.bed"

 # Create a filesystem-friendly directory name from comparison
 safe_comp  <- gsub("[^A-Za-z0-9_]+", "_", comparison)

 # Output directory for Circos files (e.g. circos_Moxi_18h_vs_Untreated_18h)
 out_dir    <- paste0("circos_", safe_comp)

 # Thresholds for significance
 padj_cutoff <- 0.05
 lfc_cutoff  <- 1      # |log2FC| >= 1

 # Bin size for density in bp (e.g. 10000 = 10 kb)
 bin_size <- 10000

 # Comparison label for Excel / plots (human-readable)
 comparison_label <- comparison

 options(scipen = 999) # turn off scientific notation

 ###############################
 # 1. Setup & packages
 ###############################

 if (!dir.exists(out_dir)) dir.create(out_dir, showWarnings = FALSE)
 data_dir <- file.path(out_dir, "data")
 if (!dir.exists(data_dir)) dir.create(data_dir, showWarnings = FALSE)

 # openxlsx for Excel export
 if (!requireNamespace("openxlsx", quietly = TRUE)) {
 stop("Package 'openxlsx' is required. Please install it with install.packages('openxlsx').")
 }
 library(openxlsx)

 ###############################
 # 2. Read data
 ###############################

 message("Reading DESeq2 results from: ", deseq_file)
 deseq <- read.csv(deseq_file, stringsAsFactors = FALSE)

 # Check required columns in DESeq2 table
 required_cols <- c("GeneID", "log2FoldChange", "padj")
 if (!all(required_cols %in% colnames(deseq))) {
 stop("DESeq2 table must contain columns: ", paste(required_cols, collapse = ", "))
 }

 message("Reading BED annotation from: ", bed_file)
 bed_cols <- c("chr","start","end","gene_id","score",
             "strand","thickStart","thickEnd",
             "itemRgb","blockCount","blockSizes","blockStarts")

 annot <- read.table(
 bed_file,
 header = FALSE,
 sep = "\t",
 stringsAsFactors = FALSE,
 col.names = bed_cols
 )

 ###############################
 # 3. Merge DESeq2 + annotation
 ###############################

 # Match DESeq2 GeneID (e.g. "gene-HJI06_09365") to BED gene_id
 merged <- merge(
 deseq,
 annot[, c("chr", "start", "end", "gene_id")],
 by.x = "GeneID",
 by.y = "gene_id"
 )

 if (nrow(merged) == 0) {
 stop("No overlap between DESeq2 GeneID and BED gene_id.")
 }

 # Midpoint of each gene
 merged$mid <- round((merged$start + merged$end) / 2)

 ###############################
 # 4. Classify genes
 ###############################

 merged$regulation <- "ns"
 merged$regulation[merged$padj < padj_cutoff & merged$log2FoldChange >=  lfc_cutoff]  <- "up"
 merged$regulation[merged$padj < padj_cutoff & merged$log2FoldChange <= -lfc_cutoff] <- "down"

 table_reg <- table(merged$regulation)
 message("Regulation counts: ", paste(names(table_reg), table_reg, collapse = " | "))

 ###############################
 # 5. Scatter files (per-gene)
 ###############################

 scatter <- merged[merged$regulation != "ns", ]

 # Circos scatter input: chr  start  end  value
 scatter_file <- file.path(data_dir, "genes_scatter.txt")
 scatter_out  <- scatter[, c("chr", "mid", "mid", "log2FoldChange")]

 write.table(scatter_out,
             scatter_file,
             quote = FALSE, sep = "\t",
             row.names = FALSE, col.names = FALSE)

 message("Written Circos scatter file: ", scatter_file)

 # Annotated scatter for Excel / inspection
 scatter_annot <- scatter[, c(
 "chr",
 "mid",              # start
 "mid",              # end
 "log2FoldChange",
 "GeneID",
 "padj",
 "regulation"
 )]
 colnames(scatter_annot)[1:4] <- c("chr", "start", "end", "log2FoldChange")

 scatter_annot_file <- file.path(data_dir, "genes_scatter_annotated.tsv")
 write.table(scatter_annot,
             scatter_annot_file,
             quote = FALSE, sep = "\t",
             row.names = FALSE, col.names = TRUE)

 message("Written annotated scatter file: ", scatter_annot_file)

 ###############################
 # 6. Density function (bins)
 ###############################

 bin_chr <- function(df_chr, bin_size, direction = c("up", "down")) {
 direction <- match.arg(direction)

 chr_name <- df_chr$chr[1]
 max_pos  <- max(df_chr$mid)

 # number of bins
 n_bins <- ceiling((max_pos + 1) / bin_size)

 starts <- seq(0, by = bin_size, length.out = n_bins)
 ends   <- starts + bin_size

 # init counts & gene lists
 counts    <- integer(n_bins)
 gene_list <- vector("list", n_bins)

 df_dir <- df_chr[df_chr$regulation == direction, ]

 if (nrow(df_dir) > 0) {
     # bin index for each gene
     bin_index <- floor(df_dir$mid / bin_size) + 1
     bin_index[bin_index < 1]        <- 1
     bin_index[bin_index > n_bins]   <- n_bins

     # accumulate counts and GeneIDs
     for (i in seq_len(nrow(df_dir))) {
     idx <- bin_index[i]
     counts[idx] <- counts[idx] + 1L
     gene_list[[idx]] <- c(gene_list[[idx]], df_dir$GeneID[i])
     }
 }

 gene_ids <- vapply(
     gene_list,
     function(x) {
     if (length(x) == 0) "" else paste(unique(x), collapse = ";")
     },
     character(1)
 )

 data.frame(
     chr      = chr_name,
     start    = as.integer(starts),
     end      = as.integer(ends),
     value    = as.integer(counts),
     gene_ids = gene_ids,
     stringsAsFactors = FALSE
 )
 }

 ###############################
 # 7. Density up/down for all chromosomes
 ###############################

 chr_list <- split(merged, merged$chr)

 density_up_list   <- lapply(chr_list, bin_chr, bin_size = bin_size, direction = "up")
 density_down_list <- lapply(chr_list, bin_size = bin_size, FUN = bin_chr, direction = "down")

 density_up   <- do.call(rbind, density_up_list)
 density_down <- do.call(rbind, density_down_list)

 # Plain Circos input (no gene_ids)
 density_up_file   <- file.path(data_dir, "density_up.txt")
 density_down_file <- file.path(data_dir, "density_down.txt")

 write.table(density_up[, c("chr", "start", "end", "value")],
             density_up_file,
             quote = FALSE, sep = "\t",
             row.names = FALSE, col.names = FALSE)

 write.table(density_down[, c("chr", "start", "end", "value")],
             density_down_file,
             quote = FALSE, sep = "\t",
             row.names = FALSE, col.names = FALSE)

 message("Written Circos density files: ",
         density_up_file, " and ", density_down_file)

 # Annotated density files (with gene_ids)
 density_up_annot_file   <- file.path(data_dir, "density_up_annotated.tsv")
 density_down_annot_file <- file.path(data_dir, "density_down_annotated.tsv")

 write.table(density_up,
             density_up_annot_file,
             quote = FALSE, sep = "\t",
             row.names = FALSE, col.names = TRUE)

 write.table(density_down,
             density_down_annot_file,
             quote = FALSE, sep = "\t",
             row.names = FALSE, col.names = TRUE)

 message("Written annotated density files: ",
         density_up_annot_file, " and ", density_down_annot_file)

 ###############################
 # 8. Export annotated tables to Excel
 ###############################

 excel_file <- file.path(
 out_dir,
 paste0("circos_annotations_", comparison_label, ".xlsx")
 )

 wb <- createWorkbook()

 addWorksheet(wb, "scatter_points")
 writeData(wb, "scatter_points", scatter_annot)

 addWorksheet(wb, "density_up")
 writeData(wb, "density_up", density_up)

 addWorksheet(wb, "density_down")
 writeData(wb, "density_down", density_down)

 saveWorkbook(wb, excel_file, overwrite = TRUE)

 message("Excel workbook written to: ", excel_file)

 message("Done.")