A consolidated reference covering TA gene organization and regulation, promoter vs RBS roles, co-transcription criteria, start-codon troubleshooting, RNA-seq analysis strategy, pulldown experiment design/controls/statistics, and multi-omics integration.
1) TA System Overview
- Composition: Paired genes encoding toxin (protein) and antitoxin (protein).
- Typical organization: Same strand, antitoxin upstream, toxin downstream, forming a bicistronic operon.
- Transcriptional control: Frequently transcribed from a shared σ⁷⁰-like promoter (−35/−10) upstream of the antitoxin.
- Autoregulation: Antitoxin or TA complex often binds operator sites near the promoter to repress transcription. Under stress (e.g., antitoxin proteolysis), repression is relieved → toxin increases.
- Functions: Stress response, persistence, plasmid maintenance, virulence modulation (family-specific).
2) Promoter vs RBS — Who Does What?
- Promoter → transcription start.
- Recognized by RNA polymerase holoenzyme (core RNAP + σ factor; often σ⁷⁰).
- −35/−10 boxes typically spaced 16–19 bp; TSS sits downstream of −10.
- RBS (Shine–Dalgarno) → translation start.
- 16S rRNA (30S) anti-SD tail base-pairs with the RBS to position the start codon (usually ATG, also GTG/TTG).
- RBS–start codon spacing commonly 5–10 nt.
- Cheats: Promoter decides where transcription begins; RBS decides where translation begins.
3) Evidence Framework for a Shared Promoter / Co-transcription
Goal: Decide whether antitoxin & toxin belong to the same transcript and quantify co-expression.
3.1 Structural / Sequence Evidence
- Genomic context: Same strand; short intergenic (<50–100 bp) or slight overlap.
- Promoter prediction: Clear −35/−10 upstream of antitoxin; no strong independent promoter upstream of toxin.
- RBS: SD-like motifs upstream of both ORFs.
- Terminator: No strong Rho-independent terminator between the pair; terminator at operon end.
3.2 RNA-seq Evidence (Strand-specific libraries preferred)
- Coverage continuity: Same-strand coverage crosses the intergenic region.
- Spanning fragments: Paired-end insert spans the antitoxin↔toxin boundary.
- Expression correlation: From all samples (e.g., 27), compute TPM/CPM correlations; Pearson/Spearman r ≥ 0.8, p<0.01; remains high within each timepoint subset.
- DE consistency: For each timepoint’s treated vs control, log2FC for both genes are same direction with FDR<0.05.
- (Optional) TSS evidence: 5′-enriched or TSS-seq reveals shared TSS cluster upstream of antitoxin.
Note: Non-strand-specific libraries weaken strand-continuity evidence; interpret cautiously.
4) Why Your Provided Sequences Start with “TTA,” Not “ATG”
- Observed “TTA” starts suggest:
- Sequences include 5′ UTR/promoter (CDS not cut at true start).
- Sequences could be reverse-complement relative to coding strand.
- Bacteria can use GTG/TTG as starts, but TTA is not a typical start codon.
- Standard resolution steps:
- BLAST the fragments to the genome to get strand & coordinates.
- Six-frame translate; on the correct strand, locate the longest ORF starting with ATG/GTG/TTG and ending at a stop.
- Verify RBS distance (5–10 nt) and domain homology (BLASTX/HMM against TA families).
- Use RNA-seq coverage shape/TSS to refine the start site.
5) RNA-seq Analysis Plan for 27 Samples (Example Design)
Design: Same strain × 3 conditions (untreated / Mitomycin C / Moxifloxacin) × 3 timepoints × 3 biological replicates = 27 samples.
5.1 Pipeline Outline
- QC & Alignment: FastQC/MultiQC → trimming → align to reference (confirm strand-specificity).
- Quantification: featureCounts/Salmon → DESeq2/edgeR normalization.
- Differential Expression:
- For each timepoint, contrast treated vs untreated (include batch if needed).
- Output per contrast: log2FC, SE, p, FDR.
- TA Co-transcription Checks:
- IGV views: same-strand continuity across intergenic; spanning fragments.
- Correlation between antitoxin & toxin across 27 samples (r, p).
- DE direction consistency for both genes.
- Pulldown Targets in RNA-seq:
- For candidate target list, extract log2FC/FDR; produce volcano/heatmaps.
- Perform functional enrichment (GO/KEGG/COG) with overlap to pulldown hits.
- Deliverables:
- IGV screenshots with annotated −35/−10, TSS, RBS, terminator.
- MA/volcano plots, sample PCA, correlation plots.
- Tables summarizing DEGs per timepoint and pulldown×RNA-seq overlaps.
6) Pulldown Experiments — Types, Controls, Statistics
6.1 Types
- Protein–protein pulldown / affinity purification: Bait = toxin/antitoxin protein (His/FLAG/biotin); ID by LC–MS/MS.
- Nucleic-acid pulldown:
- DNA pulldown: bait = promoter/operator DNA; identify bound proteins (MS).
- RNA pulldown: bait = specific RNA; identify bound proteins (MS) or enriched RNAs.
6.2 Critical Controls
- Empty vector/beads, irrelevant protein, mutant bait (disrupt binding), competition elution.
- ≥ 3 biological replicates recommended.
6.3 Hit Calling (Proteomics Example)
- Use SAINT / MSstats / DEP or log2FC + FDR thresholds, e.g. log2FC ≥ 1 & FDR ≤ 0.05, consistently detected in ≥2 replicates.
- Remove sticky background proteins (CRAPome) and ubiquitous ribosomal/chaperones where appropriate.
- Deliver a high-confidence candidate list.
6.4 Integration with RNA-seq
- Cross-table: pulldown hits vs RNA-seq log2FC/FDR across conditions/timepoints.
- Enrichment/pathways: overlap enrichment for hits and DEGs.
- Evidence ladder:
- Pulldown enrichment (binding);
- RNA-seq co-expression / DE (regulatory consistency);
- Biophysical/functional assays (EMSA/SPR/ChIP-qPCR, reporter assays) for validation.
7) Validation Roadmap (Low→High Effort)
- RT-qPCR: Junction-spanning primers across antitoxin→toxin.
- EMSA/SPR: Direct binding & affinity to operator by antitoxin/TA complex.
- Reporter / Mutagenesis: Disrupt operator/−35/−10 or RBS, assess transcription/translation impact.
- ChIP-qPCR/ChIP-seq: In vivo occupancy (if antitoxin has DNA-binding domain).
- RACE/TSS-seq: Precise TSS mapping to confirm shared promoter.
8) Practical Criteria & Verdict Grades
- Structure: Same strand; intergenic <100 bp; no strong terminator in-between.
- Promoter: Clear −35/−10 upstream of antitoxin; toxin lacks strong independent promoter.
- RNA-seq: Same-strand continuity across intergenic; boundary-spanning fragments; r ≥ 0.8 (p<0.01) across all samples; per-timepoint log2FC same direction (FDR<0.05).
- Conclusion grades: Strong support / Support / Insufficient evidence.
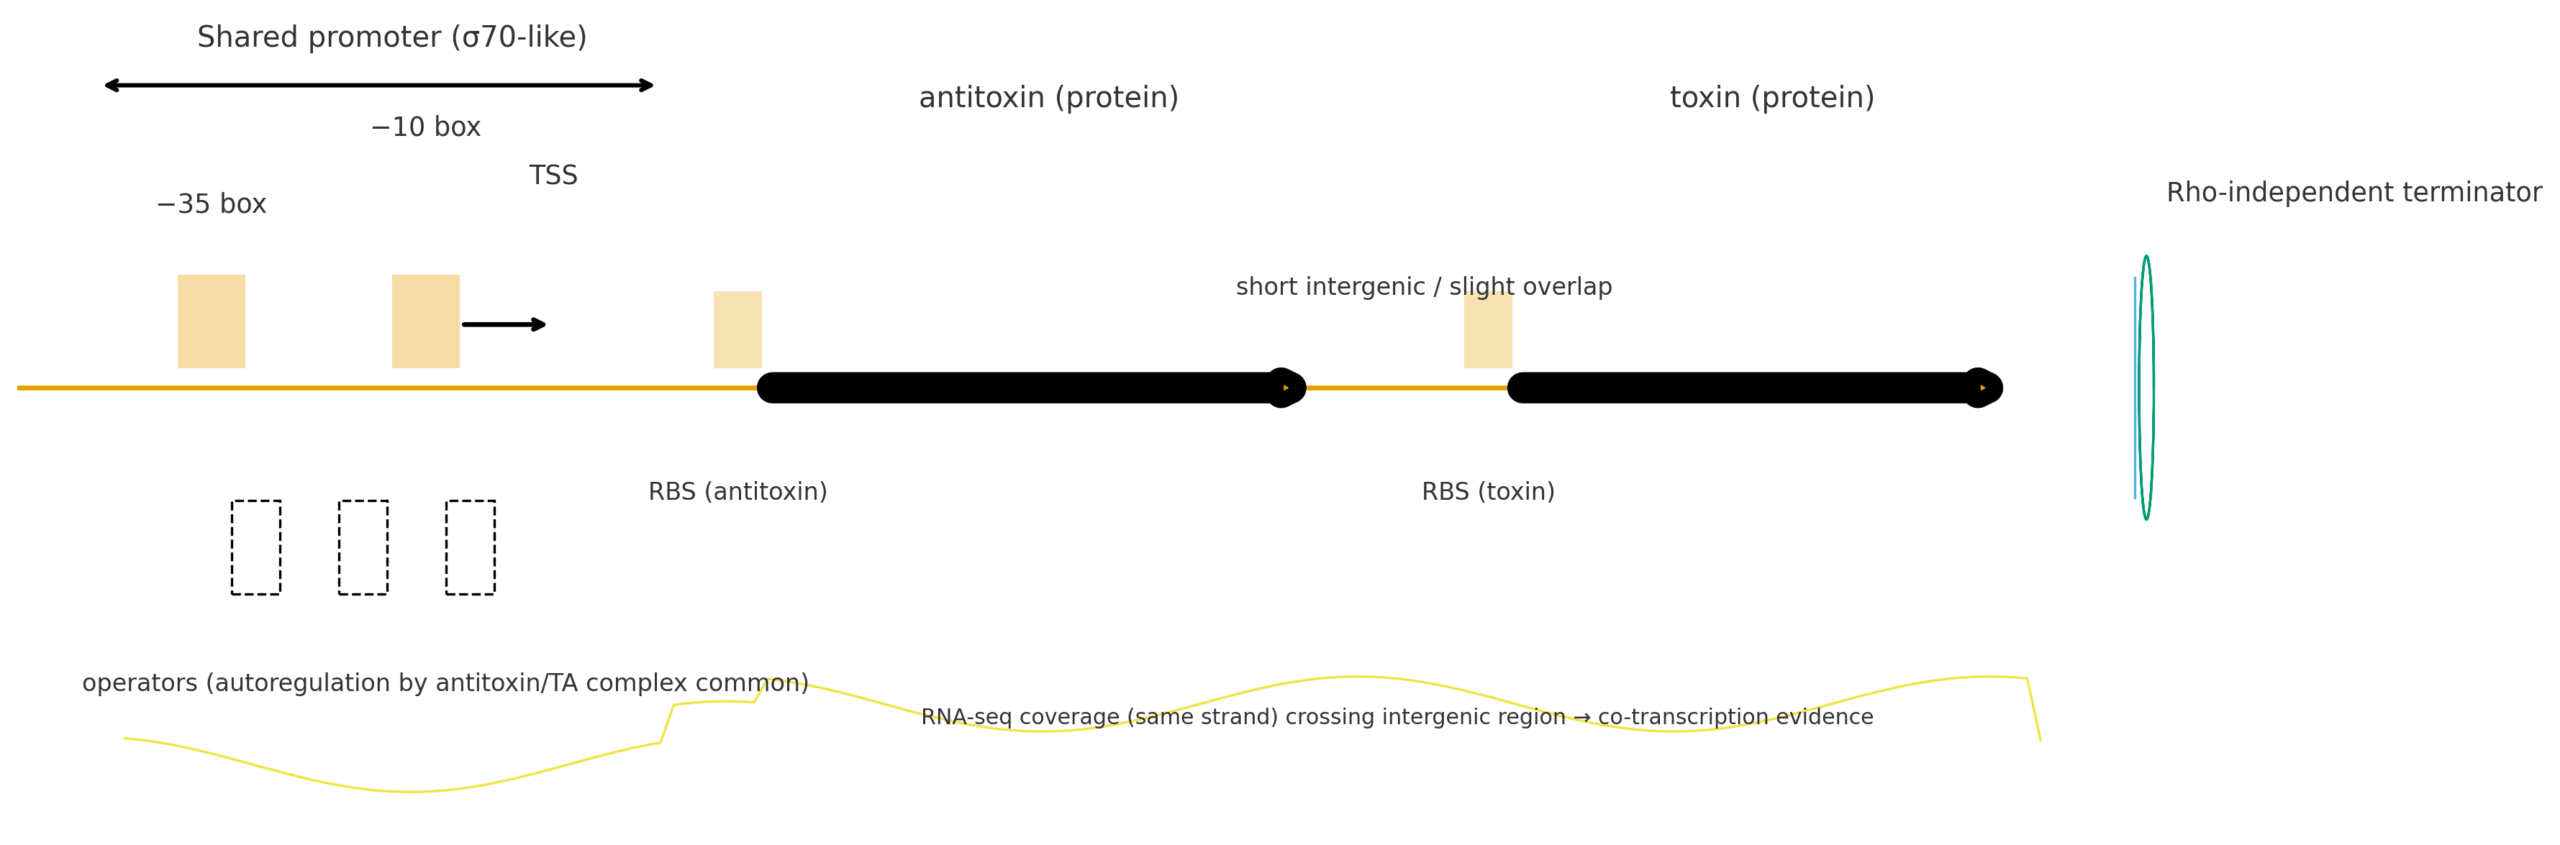
9) Schematic Figures (Generated)
- Chinese-labeled (non-overlapping):
TA_operon_shared_promoter_v3_cn.png— open/download - English-labeled (non-overlapping):
TA_operon_shared_promoter_v3_en.png— open/download
Each figure depicts: shared σ⁷⁰-like promoter (−35/−10, TSS) → antitoxin (upstream) → toxin (downstream) with each RBS, a terminal Rho-independent terminator, and stylized same-strand RNA-seq coverage that spans the intergenic region.
10) “Ready-to-Ask” Template for Collaborators
Objective: Determine if the TA pair shares a promoter and is co-transcribed; call DEGs per timepoint across conditions; test RNA-seq changes for pulldown targets.
Please deliver:
- IGV tracks with −35/−10, TSS, RBS, terminator, and boundary-spanning reads.
- DE tables (per timepoint per contrast), with log2FC/FDR.
- Correlation stats (antitoxin↔toxin r, p) across 27 samples and within timepoints.
- Pulldown×RNA-seq cross table (+ enrichment analyses).
- One-page verdict: shared promoter? co-transcription? evidence grade & key screenshots.
Inputs we’ll provide: Reference genome/annotation (FASTA/GFF/GTF), BAM/BAI, sample sheet, pulldown target list.
One-liner Summary
Promoter = transcription start; RBS = translation start.
For TA pairs, antitoxin→toxin often sits in a single operon driven by a shared promoter; RNA-seq continuity, spanning fragments, correlation, and concordant DE together provide strong evidence for co-transcription.