
Below is a sorted, step‑by‑step protocol integrating all commands and materials from your notes — organized into logical analysis phases. It outlines how to process whole‑genome data, annotate with Prokka, perform pan‑genome and SNP‑based phylogenetic analysis, and conduct resistome profiling and visualization.
1. Initial Setup and Environment Configuration
- Create and activate working environments:
conda create -n bengal3_ac3 python=3.9
conda activate /home/jhuang/miniconda3/envs/bengal3_ac3- Copy necessary config files for
bacto:
cp /home/jhuang/Tools/bacto/bacto-0.1.json .
cp /home/jhuang/Tools/bacto/Snakefile .- Prepare R environment for later visualization:
mamba create -n r_414_bioc314 -c conda-forge -c bioconda \
  r-base=4.1.3 bioconductor-ggtree bioconductor-treeio \
  r-ggplot2 r-dplyr r-ape pandoc
2. Species Assignment and MLST Screening
- Use WGS data to determine phylogenetic relationships based on MLST. Confirm species identity of isolates: E. coli, K. pneumoniae, A. baumannii complex, P. aeruginosa.
- Example log output:
[10:19:59] Excluding ecoli.icdA.262 due to --exclude option
[10:19:59] If you like MLST, you're going to absolutely love cgMLST!
[10:19:59] Done.- Observation: No strain was close enough to be a suspected clonal strain (to be confirmed later with SNP‑based analysis).
3. Genome Annotation with Prokka
Cluster isolates into four species folders and annotate each genome separately.
Example shell script:
for cluster in abaumannii_2 ecoli_achtman_4 klebsiella paeruginosa; do
  GENUS_MAP=( [abaumannii_2]="Acinetobacter" [ecoli_achtman_4]="Escherichia" [klebsiella]="Klebsiella" [paeruginosa]="Pseudomonas" )
  SPECIES_MAP=( [abaumannii_2]="baumannii" [ecoli_achtman_4]="coli" [klebsiella]="pneumoniae" [paeruginosa]="aeruginosa" )
  prokka --force --outdir prokka/${cluster} --cpus 8 \
         --genus ${GENUS_MAP[$cluster]} --species ${SPECIES_MAP[$cluster]} \
         --addgenes --addmrna --prefix ${cluster} \
         -hmm /media/jhuang/Titisee/GAMOLA2/TIGRfam_db/TIGRFAMs_15.0_HMM.LIB
 done
4. Pan‑Genome Construction with Roary
Run Roary for each species cluster (GFF outputs from Prokka):
roary -f roary/ecoli_cluster -e --mafft -p 100 prokka/ecoli_cluster/*.gff
roary -f roary/kpneumoniae_cluster1 -e --mafft -p 100 prokka/kpneumoniae_cluster1/*.gff
roary -f roary/abaumannii_cluster -e --mafft -p 100 prokka/abaumannii_cluster/*.gff
roary -f roary/paeruginosa_cluster -e --mafft -p 100 prokka/paeruginosa_cluster/*.gff
Output: core gene alignments for each species.
5. Core‑Genome Phylogenetic Tree Building (RAxML‑NG)
Use maximum likelihood reconstruction per species:
raxml-ng --all --msa roary/ecoli_achtman_4/core_gene_alignment.aln --model GTR+G --bs-trees 1000 --threads 40 --prefix ecoli_core_gene_tree_1000
raxml-ng --all --msa roary/klebsiella/core_gene_alignment.aln --model GTR+G --bs-trees 1000 --threads 40 --prefix klebsiella_core_gene_tree_1000
raxml-ng --all --msa roary/abaumannii/core_gene_alignment.aln --model GTR+G --bs-trees 1000 --threads 40 --prefix abaumannii_core_gene_tree_1000
raxml-ng --all --msa roary/paeruginosa/core_gene_alignment.aln --model GTR+G --bs-trees 1000 --threads 40 --prefix paeruginosa_core_gene_tree_1000
6. SNP Detection and Distance Calculation
- Extract SNP sites and generate distance matrices:
snp-sites -v -o core_snps.vcf roary/ecoli_achtman_4/core_gene_alignment.aln
snp-dists roary/ecoli_achtman_4/core_gene_alignment.aln > ecoli_snp_dist.tsv- Repeat for other species and convert to Excel summary:
~/Tools/csv2xls-0.4/csv_to_xls.py ecoli_snp_dist.tsv klebsiella_snp_dist.tsv abaumannii_snp_dist.tsv paeruginosa_snp_dist.tsv -d$'\t' -o snp_dist.xls7. Resistome and Virulence Profiling with Abricate
- Install and set up databases:
conda install -c bioconda -c conda-forge abricate=1.0.1
abricate --setupdb
abricate --list
DATABASE        SEQUENCES       DBTYPE  DATE
vfdb    2597    nucl    2025-Oct-22
resfinder       3077    nucl    2025-Oct-22
argannot        2223    nucl    2025-Oct-22
ecoh    597     nucl    2025-Oct-22
megares 6635    nucl    2025-Oct-22
card    2631    nucl    2025-Oct-22
ecoli_vf        2701    nucl    2025-Oct-22
plasmidfinder   460     nucl    2025-Oct-22
ncbi 5386 nucl 2025-Oct-22- Run VFDB for virulence genes:
# # Run VFDB example
# abricate --db vfdb genome.fasta > vfdb.tsv
#
# # strict filter (≥90% ID, ≥80% cov) using header-safe awk
# awk -F'\t' 'NR==1{
#   for(i=1;i<=NF;i++){if($i=="%IDENTITY") id=i; if($i=="%COVERAGE") cov=i}
#   print; next
# } ($id+0)>=90 && ($cov+0)>=80' vfdb.tsv > vfdb.strict.tsv

# 0) Define your cluster directories (exactly as in your prompt)
CLUSTERS="fasta_abaumannii_cluster fasta_kpnaumoniae_cluster1 fasta_kpnaumoniae_cluster2 fasta_kpnaumoniae_cluster3"

# 1) Run Abricate (VFDB) per isolate, strictly filtered (≥90% ID, ≥80% COV)
for D in $CLUSTERS; do
  mkdir -p "$D/abricate_vfdb"
  for F in "$D"/*.fasta; do
    ISO=$(basename "$F" .fasta)
    # raw
    abricate --db vfdb "$F" > "$D/abricate_vfdb/${ISO}.vfdb.tsv"
    # strict filter while keeping header (header-safe awk)
    awk -F'\t' 'NR==1{
      for(i=1;i<=NF;i++){if($i=="%IDENTITY") id=i; if($i=="%COVERAGE") cov=i}
      print; next
    } ($id+0)>=90 && ($cov+0)>=80' \
      "$D/abricate_vfdb/${ISO}.vfdb.tsv" > "$D/abricate_vfdb/${ISO}.vfdb.strict.tsv"
  done
done

# 2) Build per-cluster "isolate
<TAB>gene" lists (Abricate column 5 = GENE)
for D in $CLUSTERS; do
  OUT="$D/virulence_isolate_gene.tsv"
  : > "$OUT"
  for T in "$D"/abricate_vfdb/*.vfdb.strict.tsv; do
    ISO=$(basename "$T" .vfdb.strict.tsv)
    awk -F'\t' -v I="$ISO" 'NR>1{print I"\t"$5}' "$T" >> "$OUT"
  done
  sort -u "$OUT" -o "$OUT"
done

# 3) Create a per-isolate "signature" (sorted, comma-joined gene list)
for D in $CLUSTERS; do
  IN="$D/virulence_isolate_gene.tsv"
  SIG="$D/virulence_signatures.tsv"
  awk -F'\t' '
  {m[$1][$2]=1}
  END{
    for(i in m){
      n=0
      for(g in m[i]){n++; a[n]=g}
      asort(a)
      printf("%s\t", i)
      for(k=1;k<=n;k++){printf("%s%s", (k>1?",":""), a[k])}
      printf("\n")
      delete a
    }
  }' "$IN" | sort > "$SIG"
done

# 4) Report whether each cluster is internally identical
for D in $CLUSTERS; do
  SIG="$D/virulence_signatures.tsv"
  echo "== $D =="
  # how many unique signatures?
  CUT=$(cut -f2 "$SIG" | sort -u | wc -l)
  if [ "$CUT" -eq 1 ]; then
    echo "  Virulence profiles: IDENTICAL within cluster"
  else
    echo "  Virulence profiles: NOT IDENTICAL (unique signatures: $CUT)"
    echo "  --- differing isolates & their signatures ---"
    cat "$SIG"
  fi
done- Summarize VFDB results:
#----
# Make gene lists (VFDB "GENE" = column 5) for each isolate
cut -f5 fasta_kpnaumoniae_cluster2/abricate_vfdb/QRC018.vfdb.strict.tsv | tail -n +2 | sort -u > c2_018.genes.txt
cut -f5 fasta_kpnaumoniae_cluster2/abricate_vfdb/QRC070.vfdb.strict.tsv | tail -n +2 | sort -u > c2_070.genes.txt

# Show symmetric differences
echo "Genes present in QRC018 only:"
comm -23 c2_018.genes.txt c2_070.genes.txt

echo "Genes present in QRC070 only:"
comm -13 c2_018.genes.txt c2_070.genes.txt

awk -F'\t' 'NR>1{print $5"\t"$6}' fasta_kpnaumoniae_cluster2/abricate_vfdb/QRC018.vfdb.strict.tsv | sort -u > c2_018.gene_product.txt
awk -F'\t' 'NR>1{print $5"\t"$6}' fasta_kpnaumoniae_cluster2/abricate_vfdb/QRC070.vfdb.strict.tsv | sort -u > c2_070.gene_product.txt

# Genes unique to QRC018 with product
join -t $'\t' <(cut -f1 c2_018.gene_product.txt) <(cut -f1 c2_070.gene_product.txt) -v1 > /dev/null # warms caches
comm -23 <(cut -f1 c2_018.gene_product.txt | sort) <(cut -f1 c2_070.gene_product.txt | sort) \
  | xargs -I{} grep -m1 -P "^{}\t" c2_018.gene_product.txt

# Genes unique to QRC070 with product
comm -13 <(cut -f1 c2_018.gene_product.txt | sort) <(cut -f1 c2_070.gene_product.txt | sort) \
  | xargs -I{} grep -m1 -P "^{}\t" c2_070.gene_product.txt

# Make a cluster summary table from raw (or strict) TSVs
for D in fasta_abaumannii_cluster fasta_kpnaumoniae_cluster1 fasta_kpnaumoniae_cluster2 fasta_kpnaumoniae_cluster3; do
  echo "== $D =="
  abricate --summary "$D"/abricate_vfdb/*.vfdb.strict.tsv | column -t
done- Make gene presence lists and find symmetric differences between isolates:
cut -f5 fasta_kpneumoniae_cluster2/abricate_vfdb/QRC018.vfdb.strict.tsv | tail -n +2 | sort -u > c2_018.genes.txt
comm -23 c2_018.genes.txt c2_070.genes.txt
5 (Optional). For A. baumannii with zero hits, run DIAMOND BLASTp against VFDB proteins.
#If you want to be extra thorough for A. baumannii. Because your VFDB nucleotide set returned zero for A. baumannii, you can cross-check with VFDB protein via DIAMOND:
# Build a DIAMOND db (once)
diamond makedb -in VFDB_proteins.faa -d vfdb_prot
# Query predicted proteins (Prokka .faa) per isolate
for F in fasta_abaumannii_cluster/*.fasta; do
ISO=$(basename "$F" .fasta)
prokka --cpus 8 --outdir prokka/$ISO --prefix $ISO "$F"
diamond blastp -q prokka/$ISO/$ISO.faa -d vfdb_prot \
-o abricate_vfdb/$ISO.vfdb_prot.tsv \
-f 6 qseqid sseqid pident length evalue bitscore qcovhsp \
--id 90 --query-cover 80 --max-target-seqs 1 --threads 8
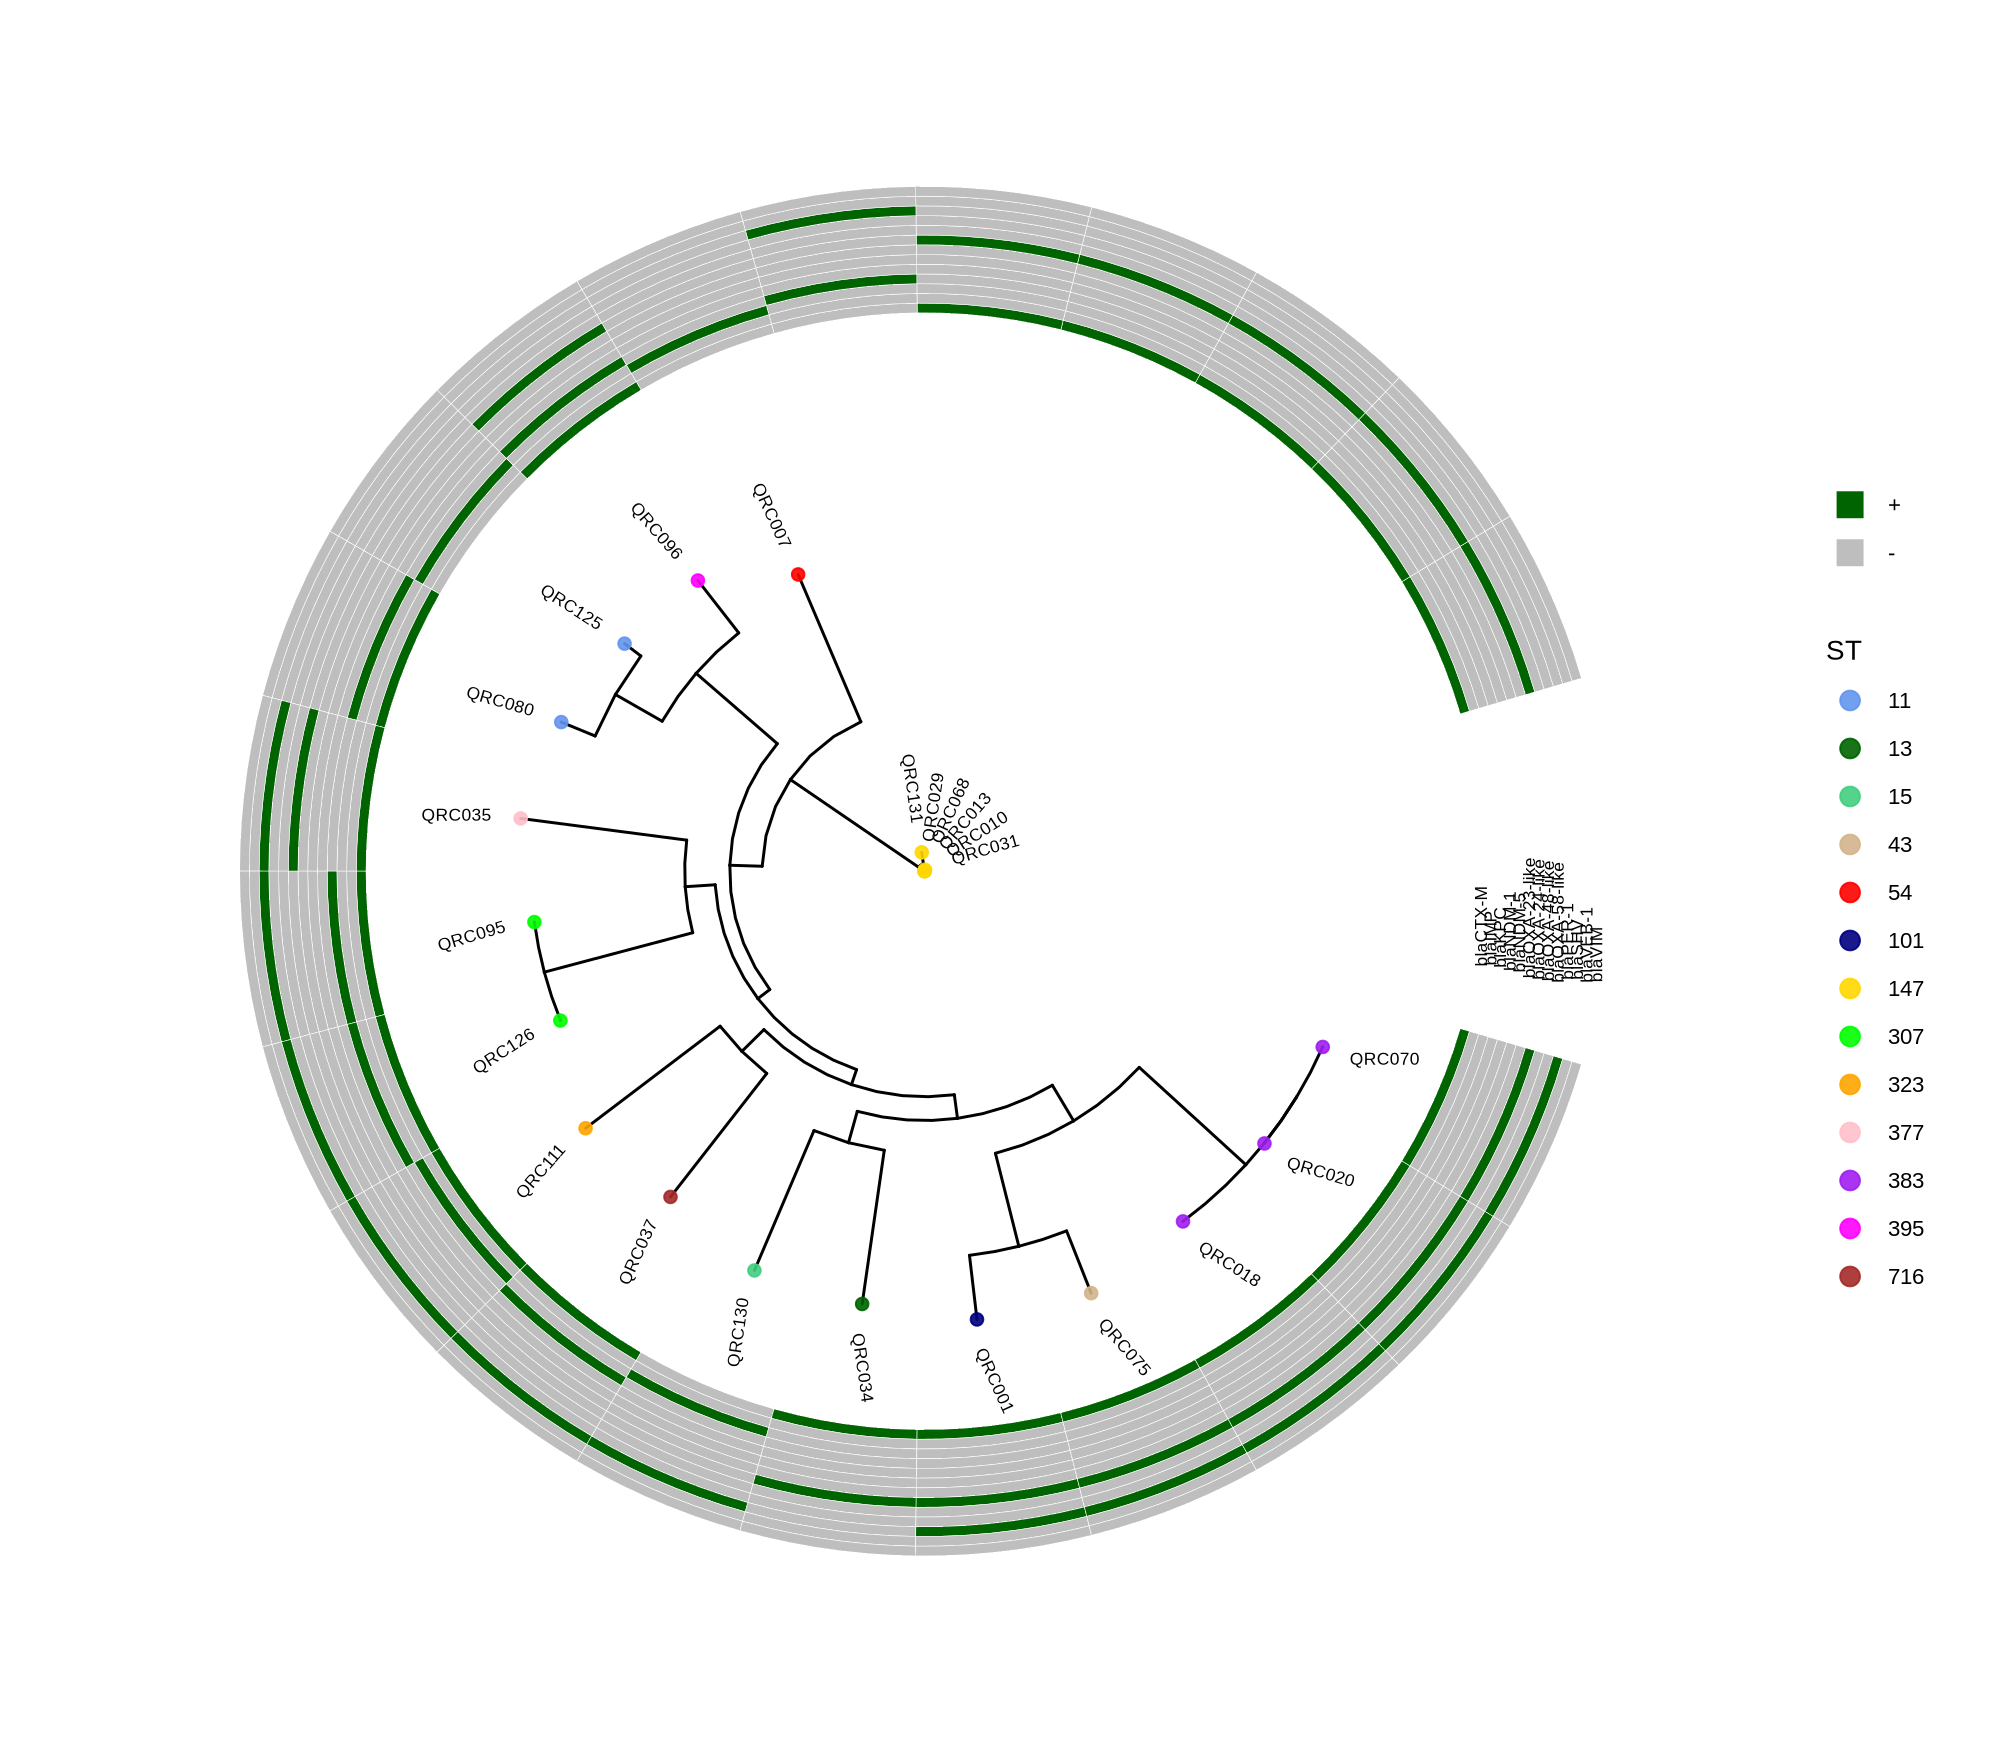
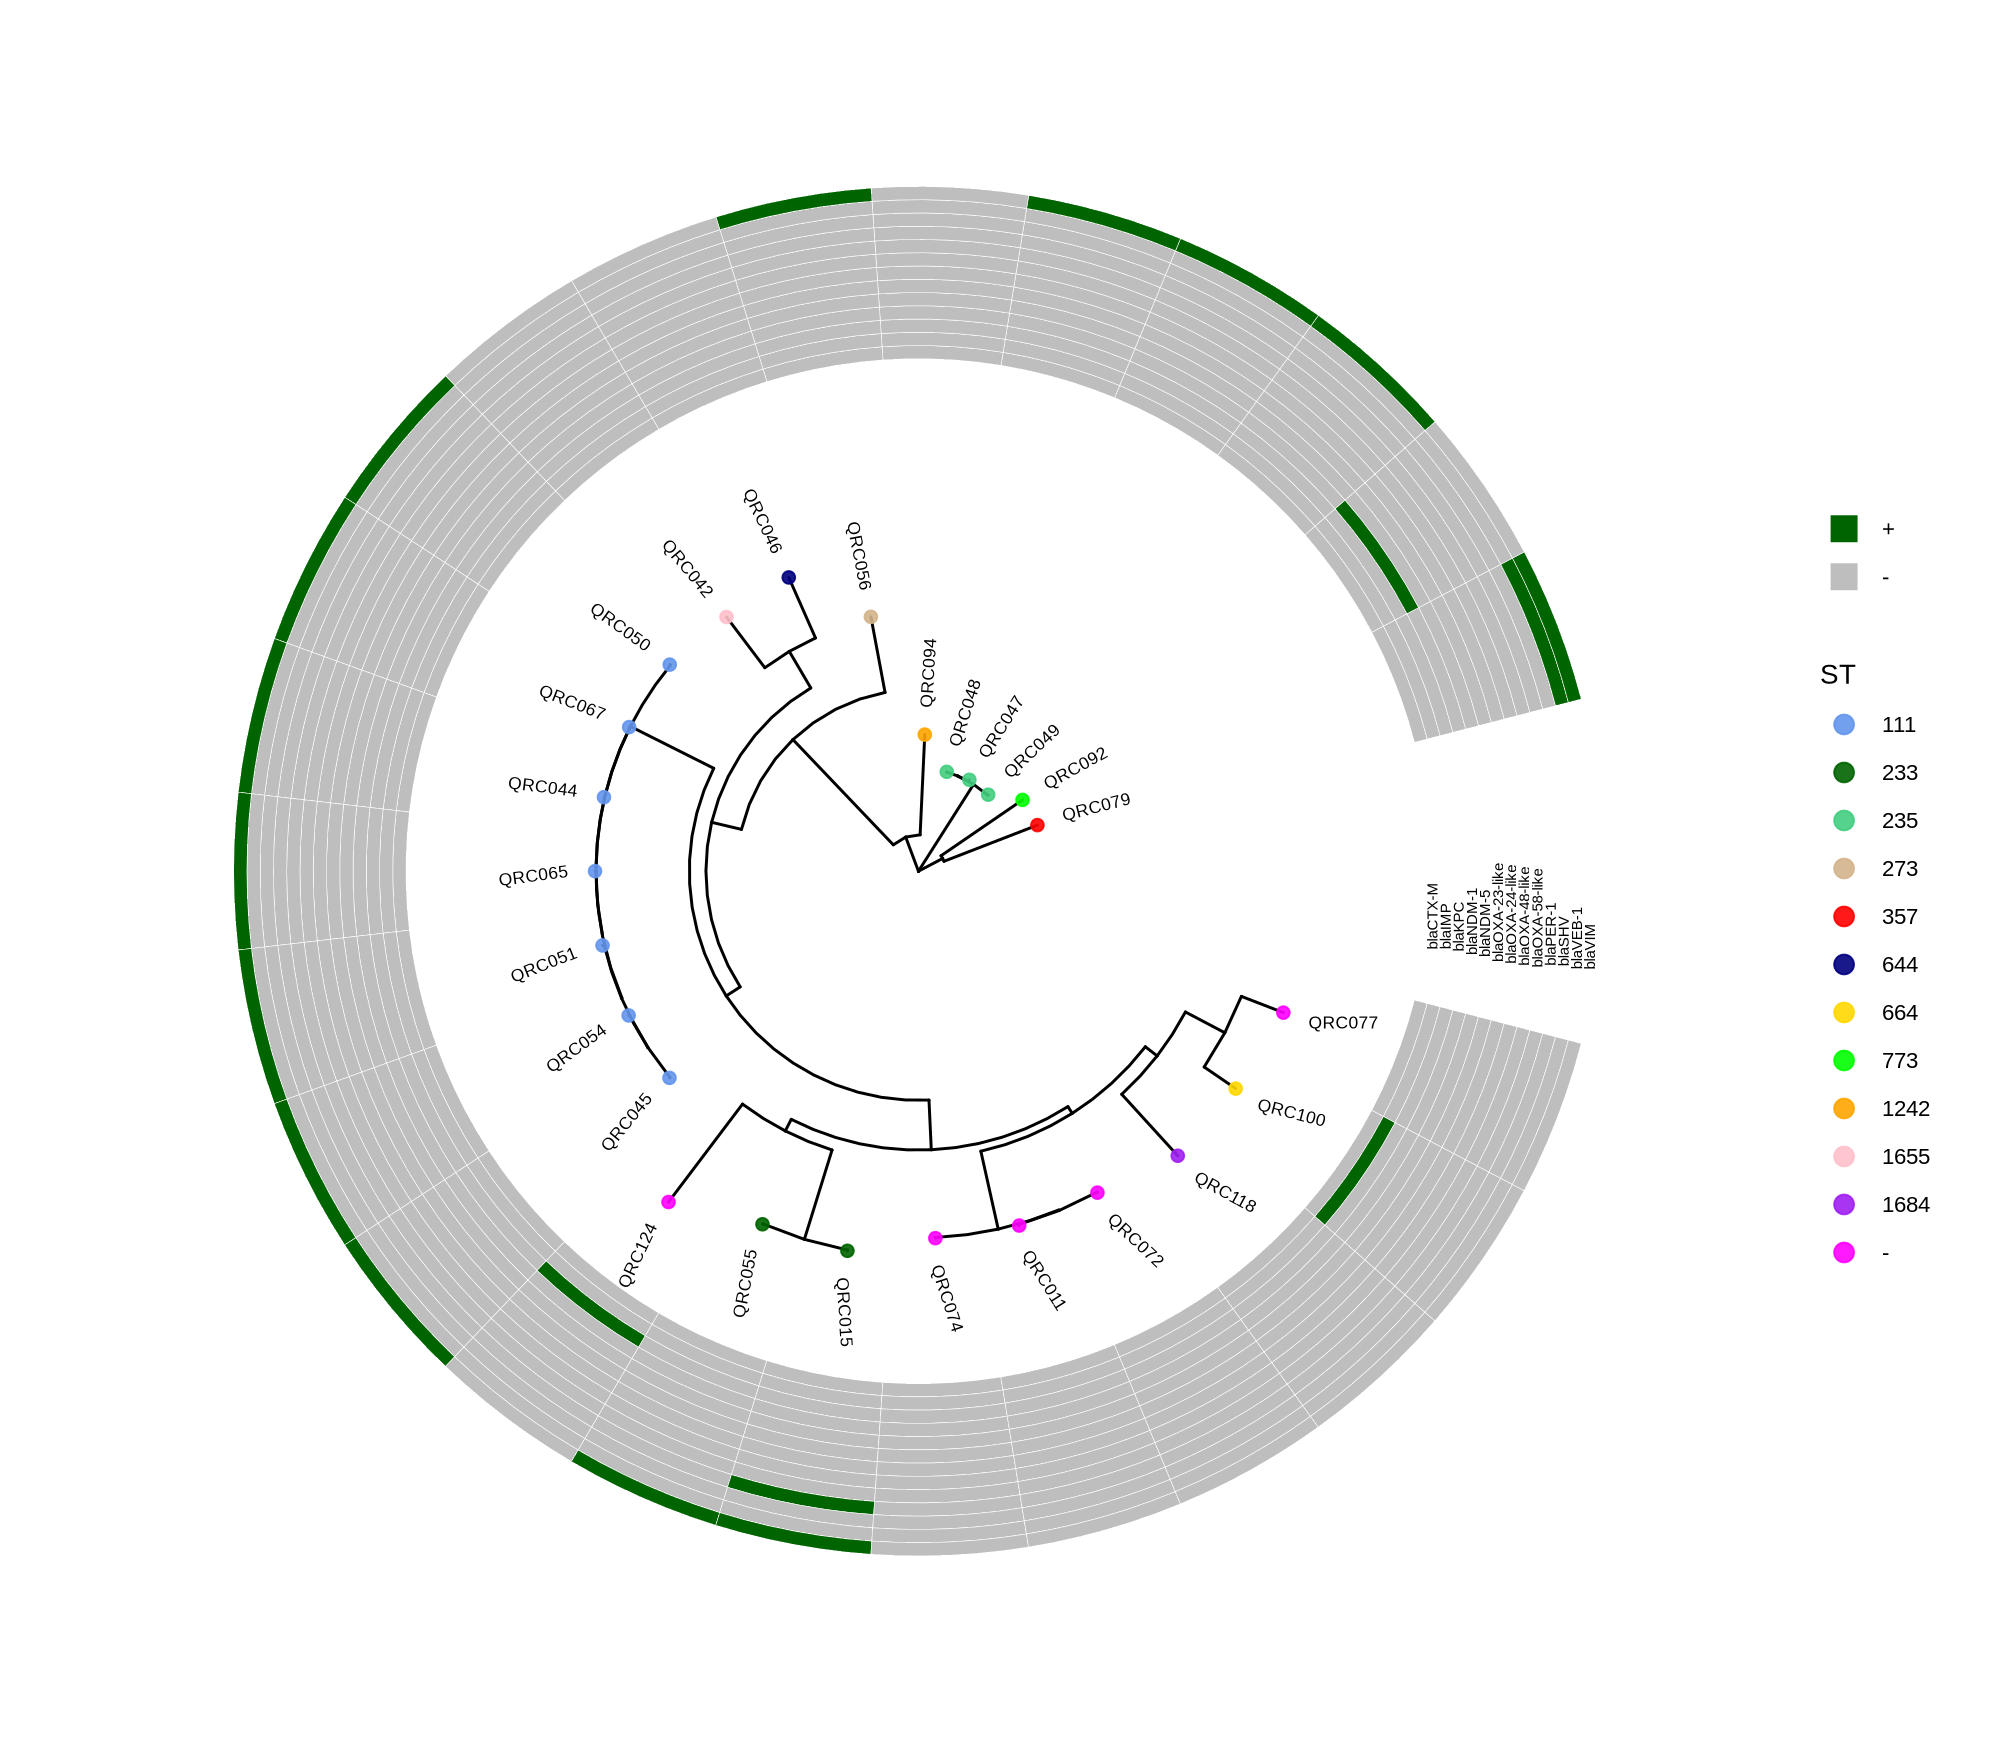
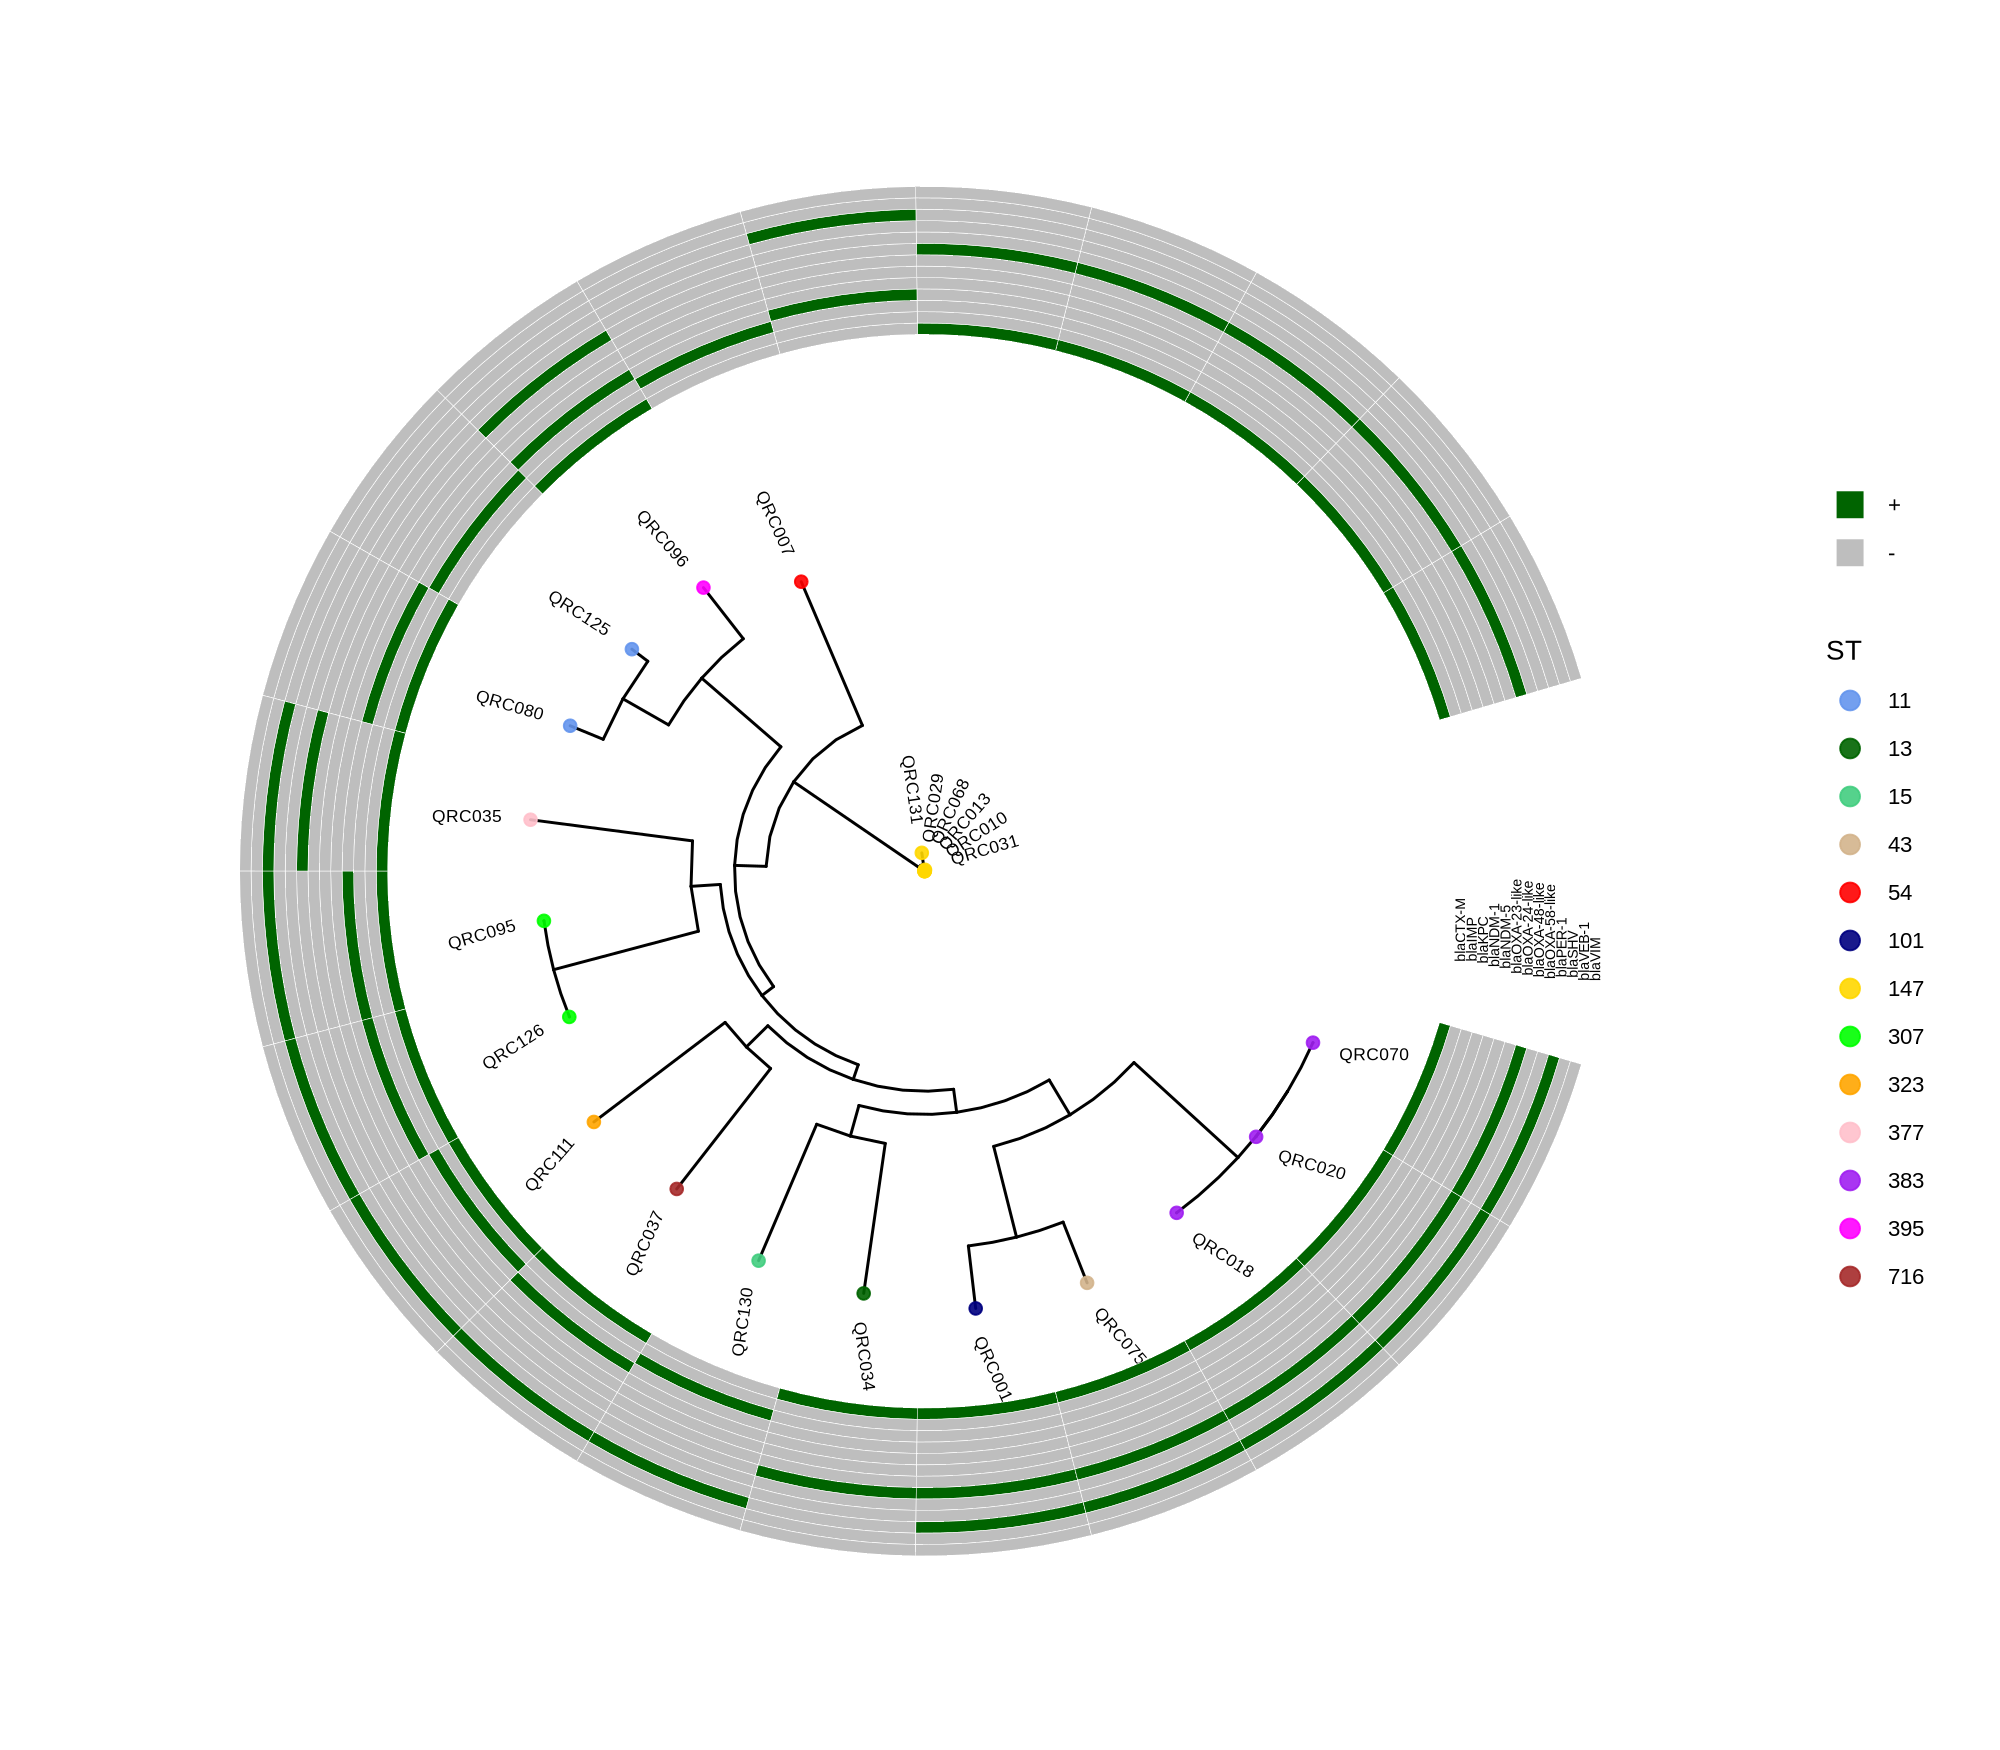
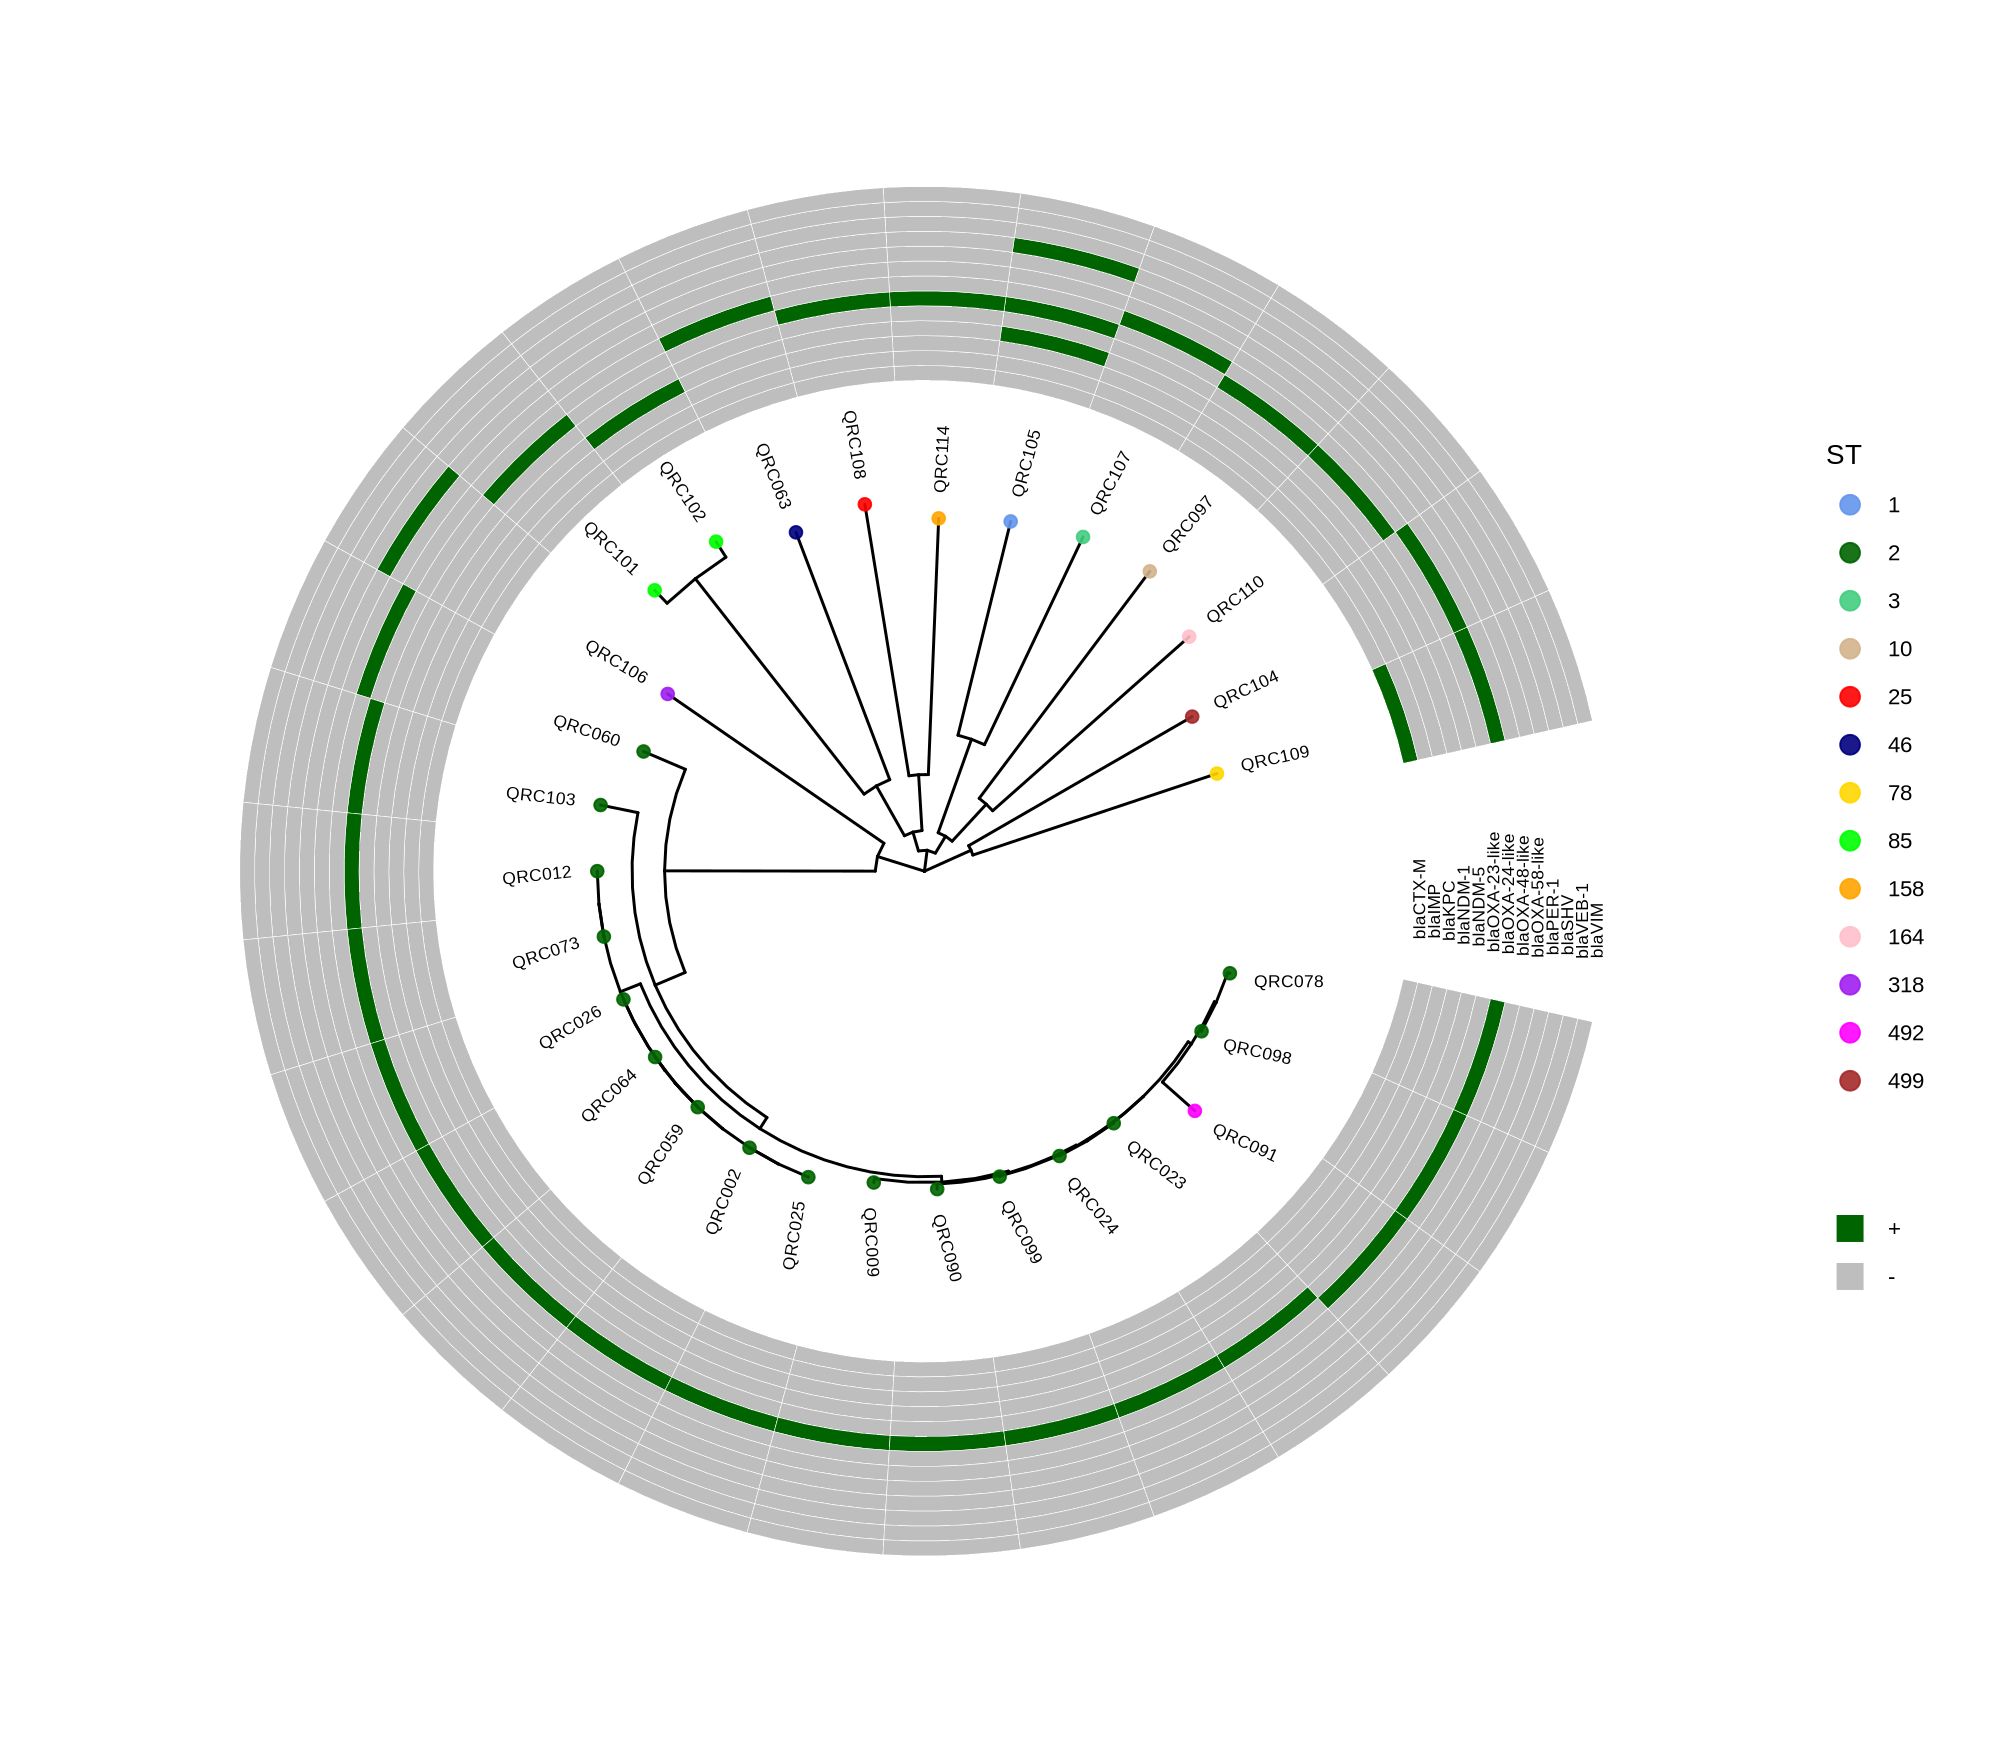
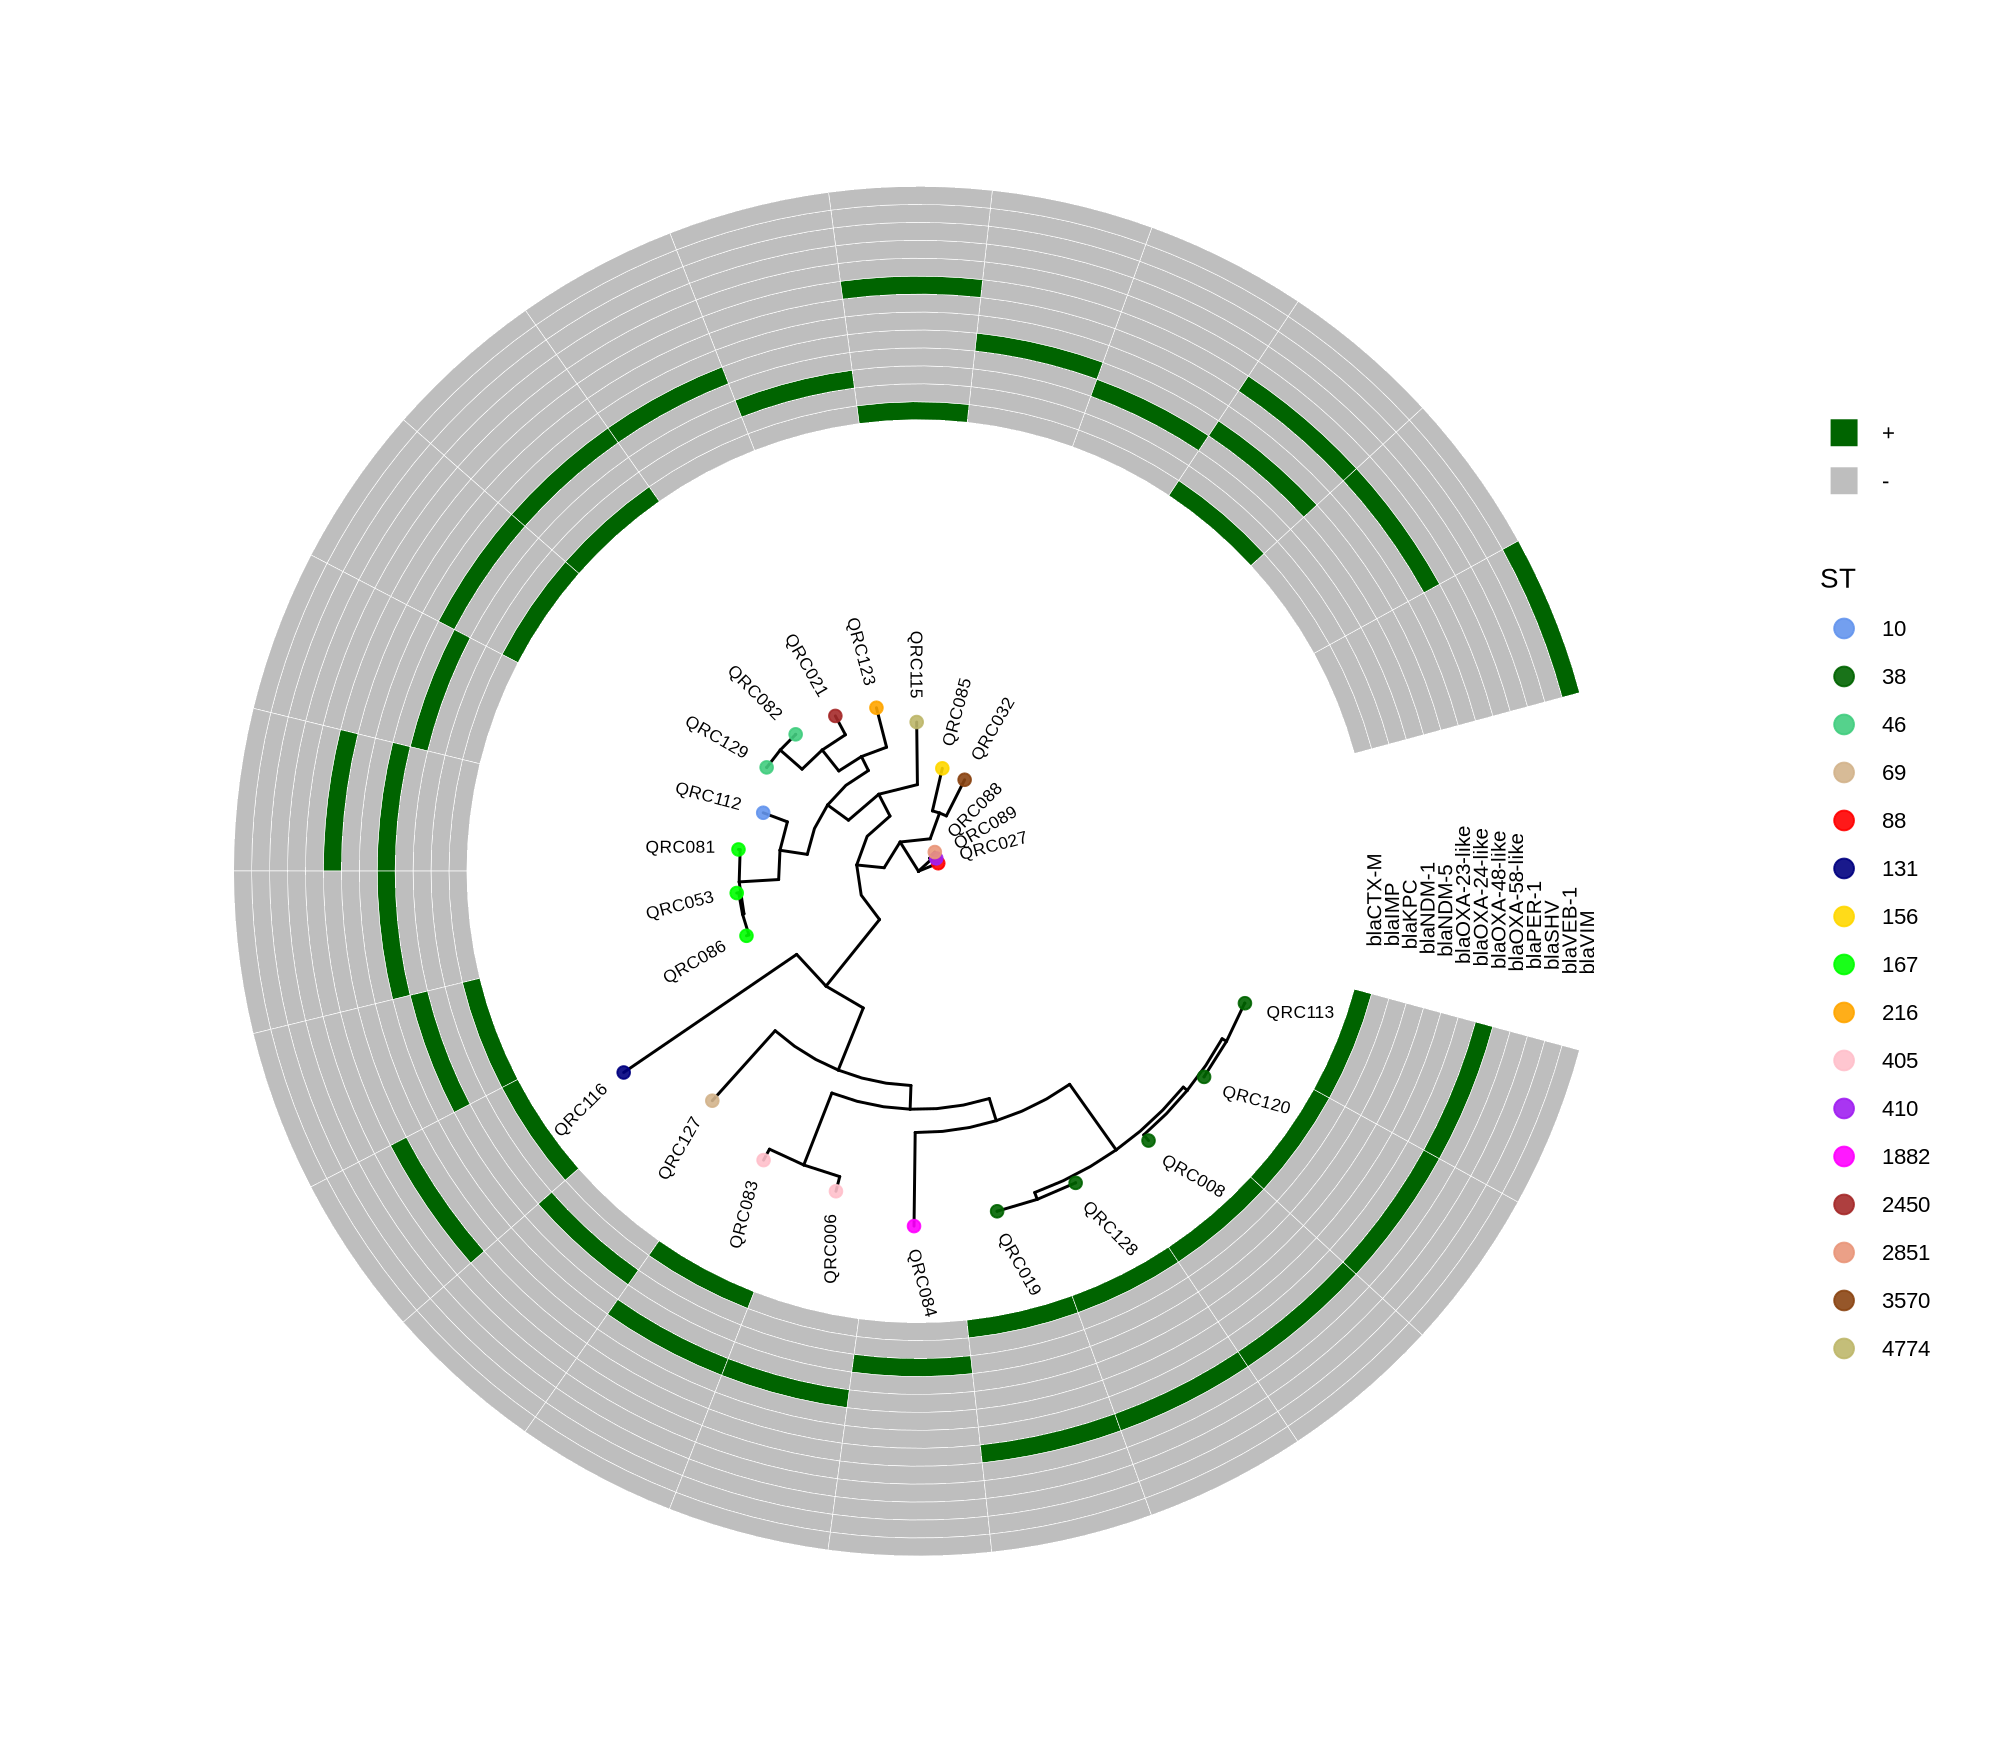
done8. Visualization with ggtree and Heatmaps
Render circular core genome trees and overlay selected ARGs or gene presence/absence matrices.
Key R snippet:
library(ggtree)
library(ggplot2)
library(dplyr)
info <- read.csv("typing_until_ecpA.csv", sep="\t")
tree <- read.tree("raxml-ng/snippy.core.aln.raxml.tree")
p <- ggtree(tree, layout='circular', branch.length='none') %<+% info +
     geom_tippoint(aes(color=ST), size=4) + geom_tiplab2(aes(label=name), offset=1)
gheatmap(p, heatmapData2, width=4, colnames_angle=45, offset=4.2)
Output: multi‑layer circular tree (e.g., ggtree_and_gheatmap_selected_genes.png).
9. Final Analyses and Reporting
- Compute pairwise SNP distances and identify potential clonal clusters using species‑specific thresholds (e.g., ≤17 SNPs for E. coli).
- If clones exist, retain one representative per cluster for subsequent Boruta analysis or CA/EA metrics.
- Integrate ARG heatmaps to the trees for intuitive visualization of resistance determinants relative to phylogeny.
Protocol Description Summary
This workflow systematically processes WGS data from multiple bacterial species:
- Annotation (Prokka) ensures consistent gene predictions.
- Pan‑genome alignment (Roary) captures core and accessory variation.
- Phylogenetic reconstruction (RAxML‑NG) provides species‑level evolutionary context.
- SNP‑distance computation (snp‑sites, snp‑dists) allows clonal determination and diversity quantification.
- Resistome analysis (Abricate, Diamond) characterizes antimicrobial resistance and virulence determinants.
- Visualization (ggtree + gheatmap) integrates tree topology with gene presence–absence or ARG annotations.
Properly documented, this end‑to‑end pipeline can serve as the Methods section for publication or as an online reproducible workflow guide.
Methods (for the manuscript). Genomes were annotated with PROKKA v1.14.5 [1]. A pangenome was built with Roary v3.13.0 [2] using default settings (95% protein identity) to derive a gene presence/absence matrix. Core genes—defined as present in 99–100% of isolates by Roary—were individually aligned with MAFFT v7 [3] and concatenated; the resulting multiple alignment was used to infer a maximum-likelihood phylogeny in RAxML-NG [4] under GTR+G, with 1,000 bootstrap replicates [5] and a random starting tree. Trees were visualized with the R package ggtree [6] in circular layout; tip colors denote sequence type (ST), with MLST assigned via PubMLST/BIGSdb [7]; concentric heatmap rings indicate the presence (+) or absence (-) of resistance genes.
- Seemann T. 2014. Prokka: rapid prokaryotic genome annotation. Bioinformatics 30:2068–2069.
- Page AJ, Cummins CA, Hunt M, Wong VK, Reuter S, Holden MTG, Fookes M, Falush D, Keane JA, Parkhill J. 2015. Roary: rapid large-scale prokaryote pan genome analysis. Bioinformatics 31:3691–3693.
- Katoh K, Standley DM. 2013. MAFFT multiple sequence alignment software version 7: improvements in performance and usability. Molecular Biology and Evolution 30:772–780.
- Kozlov AM, Darriba D, Flouri T, Morel B, Stamatakis A, Wren J. 2019. RAxML-NG: a fast, scalable and user-friendly tool for maximum likelihood phylogenetic inference. Bioinformatics 35:4453–4455.
- Felsenstein J. 1985. Confidence limits on phylogenies: an approach using the bootstrap. Evolution 39:783–791.
- Yu G, Smith DK, Zhu H, Guan Y, Lam TT-Y. 2017. ggtree: an R package for visualization and annotation of phylogenetic trees. Methods in Ecology and Evolution 8(1):28–36.
- Jolley KA, Bray JE, Maiden MCJ. 2018. Open-access bacterial population genomics: BIGSdb software, the PubMLST.org website and their applications. Wellcome Open Res 3:124.