Draw plots for miRNAs generated by COMPSRA
gene_x 0 like s 690 view s
Tags: pipeline
-
Generate the following files according to STEPS 1-4 from http://xgenes.com/article/article-content/239/small-rna-sequencing-processing-in-the-example-of-smallrna-7/, http://xgenes.com/article/article-content/232/small-rna-sequencing-processing-in-the-example-of-smallrna-7/, and http://xgenes.com/article/article-content/156/small-rna-processing/. For COMPSRA_MERGE_0_miRNA.txt, we also need STEP 5 to add the read numbers of MCPyV-M1.
COMPSRA_MERGE_0_miRNA.txt * COMPSRA_MERGE_0_piRNA.txt * COMPSRA_MERGE_0_snRNA.txt * COMPSRA_MERGE_0_tRNA.txt COMPSRA_MERGE_0_snoRNA.txt COMPSRA_MERGE_0_circRNA.txt -
Input files for miRNA are two files: COMPSRA_MERGE_0_miRNA.txt and ids under "/media/jhuang/Elements/Data_Ute/Data_Ute_smallRNA_7/miRNA_re"
-
COMPSRA_MERGE_0_miRNA.txt
#./our_out_without_cutadapt/COMPSRA_MERGE_0_miRNA.txt #./our_out_on_hg38/COMPSRA_MERGE_0_miRNA.txt #./our_out_on_hg38+JN707599_miRNA_merging_replicates/COMPSRA_MERGE_0_miRNA.txt diff ./our_out_on_hg38/COMPSRA_MERGE_0_miRNA.txt ./our_out_on_hg38+JN707599_miRNA_merging_replicates/COMPSRA_MERGE_0_miRNA.txt #--> different! #BUG: why using the same code resulting in different miRNA results! A little different!! #--> using ./our_out_on_hg38+JN707599_miRNA_merging_replicates/COMPSRA_MERGE_0_miRNA.txt
cp our_out_on_hg38+JN707599_miRNA_merging_replicates/COMPSRA_MERGE_0_miRNA.txt miRNA_re cd miRNA_re
-
prepare the file ids
#cp ./our_out_on_hg38+JN707599_miRNA_merging_replicates/ids miRNA_re for i in EV_vs_parental sT_Dox_vs_sT_DMSO sT_Dox_vs_scr_Dox scr_Dox_vs_scr_DMSO sT_DMSO_vs_scr_DMSO; do echo "cut -d',' -f1-1 ${i}-up.txt > ${i}-up.id"; echo "cut -d',' -f1-1 ${i}-down.txt > ${i}-down.id"; done cat *.id | sort -u > ids #add Gene_Id in the first line, delete the ""
-
-
Draw plots with R using DESeq2
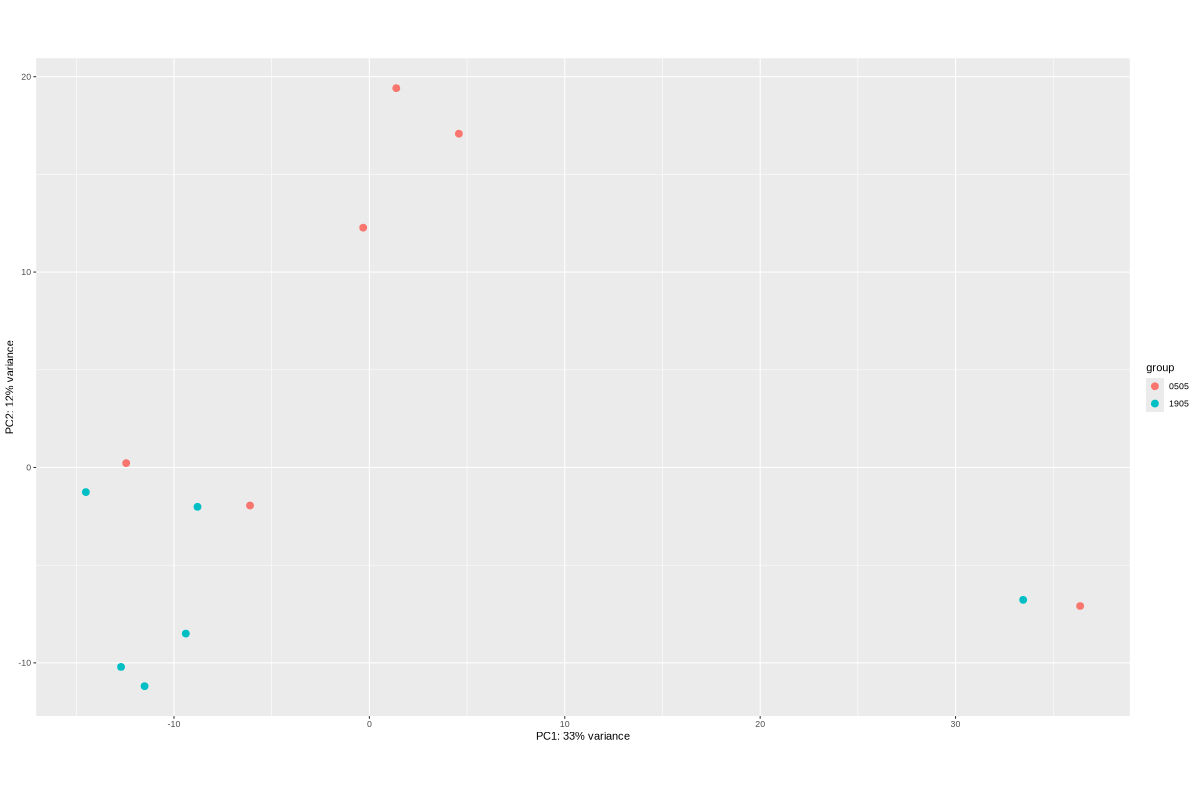
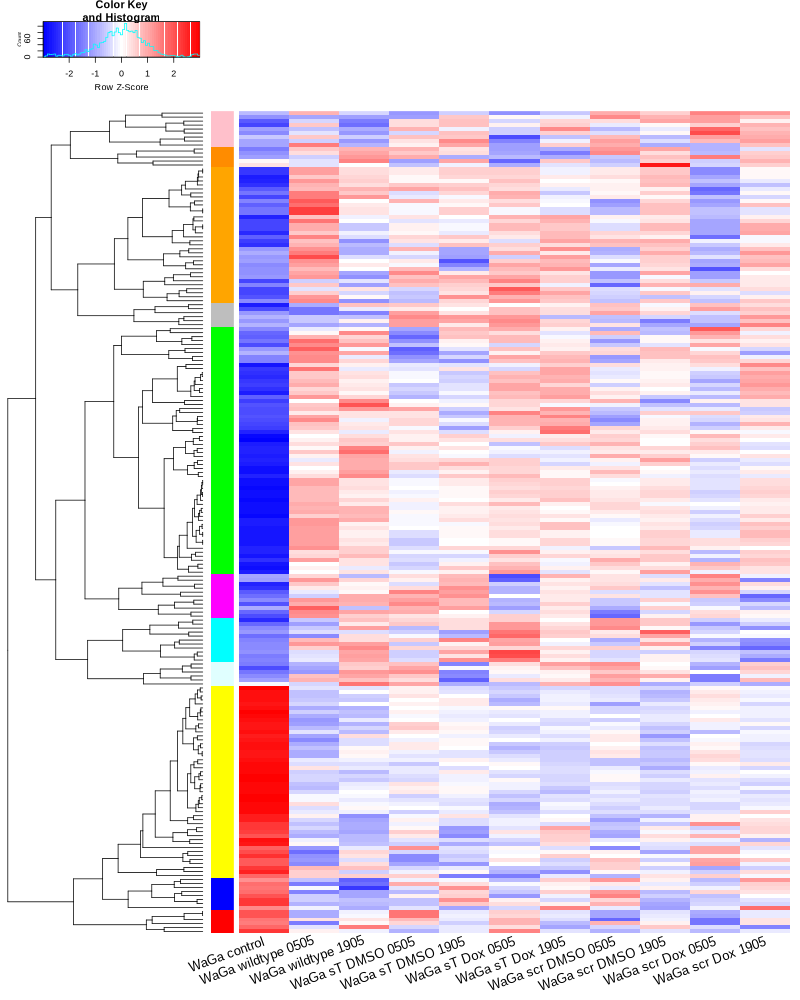
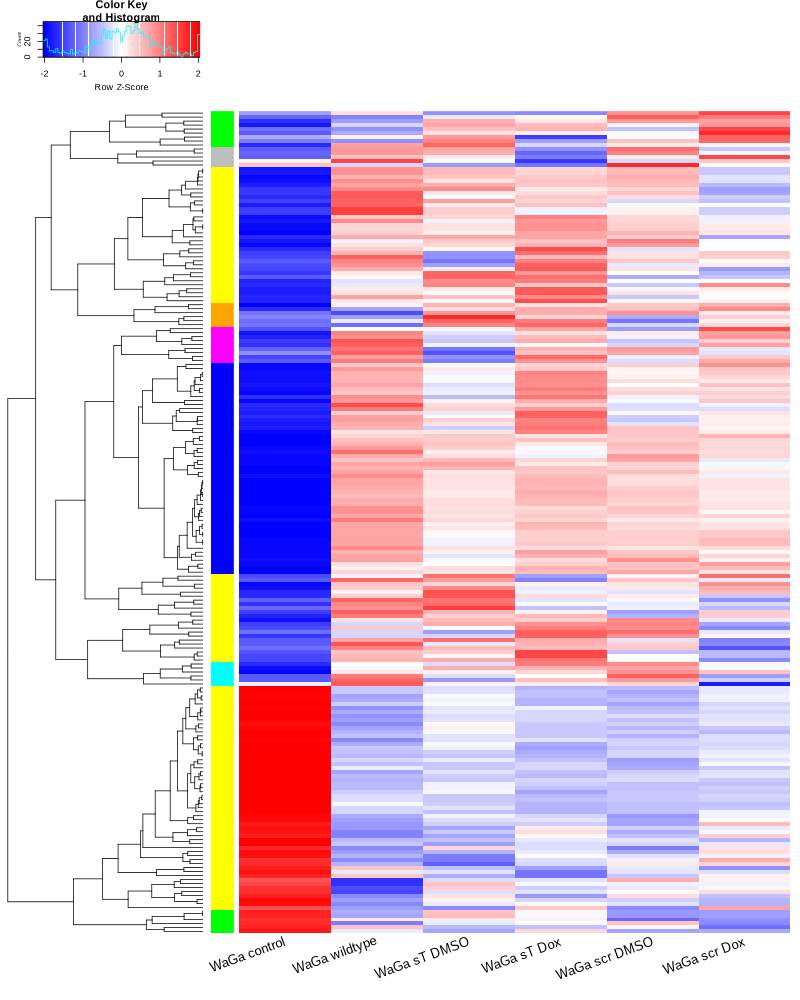
#BiocManager::install("AnnotationDbi") #BiocManager::install("clusterProfiler") #BiocManager::install(c("ReactomePA","org.Hs.eg.db")) #BiocManager::install("limma") library("AnnotationDbi") library("clusterProfiler") library("ReactomePA") library("org.Hs.eg.db") library(DESeq2) library(gplots) library(limma) # Check the current library paths .libPaths() #setwd("/home/jhuang/DATA/Data_Ute/Data_Ute_smallRNA_7/our_out_on_hg38+JN707599_2024_corrected/") d.raw<- read.delim2("COMPSRA_MERGE_0_miRNA.txt",sep="\t", header=TRUE, row.names=1) d.raw$X <- NULL #colnames(d.raw)<- c("WaGa_EV", "MKL1_EV", "WaGa_wt", "MKL1_wt") d.raw[] <- lapply(d.raw, as.numeric) #MCPyV-M1 0 0 29 0 23 0 30 8 0 0 202 196 # New row to add new_row <- data.frame( X0505_WaGa_sT_DMSO = 0, X1905_WaGa_sT_DMSO = 0, X0505_WaGa_sT_Dox = 29, X1905_WaGa_sT_Dox = 0, X0505_WaGa_scr_DMSO = 23, X1905_WaGa_scr_DMSO = 0, X0505_WaGa_scr_Dox = 30, X1905_WaGa_scr_Dox = 8, X0505_WaGa_wt = 0, X1905_WaGa_wt = 0, control_MKL1 = 202, control_WaGa = 196, row.names = "MCPyV-M1" ) # Add the new row to the data frame d.raw <- rbind(d.raw, new_row) #cell_line = as.factor(c("WaGa","WaGa", "WaGa","WaGa", "WaGa","WaGa", "WaGa","WaGa", "WaGa","WaGa", "MKL1","WaGa")) #condition = as.factor(c("sT","sT", "sT","sT", "scr","scr", "scr","scr", "wt","wt", "control","control")) #treatment = as.factor(c("DMSO","DMSO", "Dox","Dox", "DMSO","DMSO", "Dox","Dox", "wt","wt", "control","control")) EV_or_parental = as.factor(c("EV","EV", "EV","EV", "EV","EV", "EV","EV", "EV","EV", "parental","parental")) donor = as.factor(c("0505","1905", "0505","1905", "0505","1905", "0505","1905", "0505","1905", "0505","1905")) replicates = as.factor(c("sT_DMSO","sT_DMSO", "sT_Dox","sT_Dox", "scr_DMSO","scr_DMSO", "scr_Dox","scr_Dox", "wt","wt", "control","control")) ids = as.factor(c("0505_WaGa_sT_DMSO","1905_WaGa_sT_DMSO","0505_WaGa_sT_Dox","1905_WaGa_sT_Dox","0505_WaGa_scr_DMSO","1905_WaGa_scr_DMSO","0505_WaGa_scr_Dox","1905_WaGa_scr_Dox","0505_WaGa_wt","1905_WaGa_wt","control_MKL1","control_WaGa")) cData = data.frame(row.names=colnames(d.raw), replicates=replicates, ids=ids, donor=donor, EV_or_parental=EV_or_parental) dds<-DESeqDataSetFromMatrix(countData=d.raw, colData=cData, design=~replicates+donor) rld <- rlogTransformation(dds) # -- before pca -- png("pca.png", 1200, 800) plotPCA(rld, intgroup=c("replicates")) #plotPCA(rld, intgroup = c("replicates", "batch")) #plotPCA(rld, intgroup = c("replicates", "ids")) #plotPCA(rld, "batch") dev.off() png("pca2.png", 1200, 800) plotPCA(rld, intgroup=c("donor")) dev.off() ##### STEP3: prepare all_genes ##### rld <- rlogTransformation(dds) mat <- assay(rld) mm <- model.matrix(~replicates, colData(rld)) mat <- limma::removeBatchEffect(mat, batch=rld$donor, design=mm) assay(rld) <- mat RNASeq.NoCellLine <- assay(rld) # reorder the columns colnames(RNASeq.NoCellLine) = c("0505 WaGa sT DMSO","1905 WaGa sT DMSO","0505 WaGa sT Dox","1905 WaGa sT Dox","0505 WaGa scr DMSO","1905 WaGa scr DMSO","0505 WaGa scr Dox","1905 WaGa scr Dox","0505 WaGa wt","1905 WaGa wt","control MKL1","control WaGa") col.order <-c("control MKL1", "control WaGa","0505 WaGa wt","1905 WaGa wt","0505 WaGa sT DMSO","1905 WaGa sT DMSO","0505 WaGa sT Dox","1905 WaGa sT Dox","0505 WaGa scr DMSO","1905 WaGa scr DMSO","0505 WaGa scr Dox","1905 WaGa scr Dox") RNASeq.NoCellLine <- RNASeq.NoCellLine[,col.order] #Option4: manully defining #for i in EV_vs_parental sT_Dox_vs_sT_DMSO sT_Dox_vs_scr_Dox scr_Dox_vs_scr_DMSO sT_DMSO_vs_scr_DMSO; do echo "cut -d',' -f1-1 ${i}-up.txt > ${i}-up.id"; echo "cut -d',' -f1-1 ${i}-down.txt > ${i}-down.id"; done #cat *.id | sort -u > ids ##add Gene_Id in the first line, delete the "" GOI <- read.csv("ids")$Gene_Id datamat = RNASeq.NoCellLine[GOI, ] ##### STEP4: clustering the genes and draw heatmap ##### datamat <- datamat[,-1] #delete the sample "control MKL1" colnames(datamat)[1] <- "WaGa control" #rename the isolate names according to the style of RNA-seq as follows? colnames(datamat)[2] <- "WaGa wildtype 0505" colnames(datamat)[3] <- "WaGa wildtype 1905" colnames(datamat)[4] <- "WaGa sT DMSO 0505" colnames(datamat)[5] <- "WaGa sT DMSO 1905" colnames(datamat)[6] <- "WaGa sT Dox 0505" colnames(datamat)[7] <- "WaGa sT Dox 1905" colnames(datamat)[8] <- "WaGa scr DMSO 0505" colnames(datamat)[9] <- "WaGa scr DMSO 1905" colnames(datamat)[10] <- "WaGa scr Dox 0505" colnames(datamat)[11] <- "WaGa scr Dox 1905" write.csv(datamat, file ="gene_expression_keeping_replicates.txt") #"ward.D"’, ‘"ward.D2"’,‘"single"’, ‘"complete"’, ‘"average"’ (= UPGMA), ‘"mcquitty"’(= WPGMA), ‘"median"’ (= WPGMC) or ‘"centroid"’ (= UPGMC) hr <- hclust(as.dist(1-cor(t(datamat), method="pearson")), method="complete") hc <- hclust(as.dist(1-cor(datamat, method="spearman")), method="complete") mycl = cutree(hr, h=max(hr$height)/2.0) mycol = c("YELLOW", "BLUE", "ORANGE", "CYAN", "GREEN", "MAGENTA", "GREY", "LIGHTCYAN", "RED", "PINK", "DARKORANGE", "MAROON", "LIGHTGREEN", "DARKBLUE", "DARKRED", "LIGHTBLUE", "DARKCYAN", "DARKGREEN", "DARKMAGENTA"); mycol = mycol[as.vector(mycl)] png("miRNA_heatmap_keeping_replicates.png", width=800, height=1000) #svg("DEGs_heatmap_keeping_replicates.svg", width=6, height=8) heatmap.2(as.matrix(datamat), Rowv=as.dendrogram(hr), Colv=NA, dendrogram='row', labRow="", scale='row', trace='none', col=bluered(75), RowSideColors=mycol, srtCol=20, lhei=c(1,8), #cexRow=1.2, # Increase row label font size cexCol=1.7, # Increase column label font size margin=c(7,1) ) dev.off() #### cluster members ##### write.csv(names(subset(mycl, mycl == '1')),file='YELLOW.txt') write.csv(names(subset(mycl, mycl == '2')),file='BLUE.txt') write.csv(names(subset(mycl, mycl == '3')),file='ORANGE.txt') write.csv(names(subset(mycl, mycl == '4')),file='CYAN.txt') write.csv(names(subset(mycl, mycl == '5')),file='GREEN.txt') write.csv(names(subset(mycl, mycl == '6')),file='MAGENTA.txt') write.csv(names(subset(mycl, mycl == '7')),file='GREY.txt') write.csv(names(subset(mycl, mycl == '8')),file='LIGHTCYAN.txt') write.csv(names(subset(mycl, mycl == '9')),file='RED.txt') #~/Tools/csv2xls-0.4/csv_to_xls.py gene_expression_keeping_replicates.txt YELLOW.txt ORANGE.txt BLUE.txt GREEN.txt CYAN.txt MAGENTA.txt LIGHTCYAN.txt GREY.txt RED.txt -d',' -o miRNA_heatmap_keeping_replicates.xls # merging replicates datamat <- cbind(datamat, "WaGa wildtype" = rowMeans(datamat[, 2:3])) datamat <- cbind(datamat, "WaGa sT DMSO" = rowMeans(datamat[, 4:5])) datamat <- cbind(datamat, "WaGa sT Dox" = rowMeans(datamat[, 6:7])) datamat <- cbind(datamat, "WaGa scr DMSO" = rowMeans(datamat[, 8:9])) datamat <- cbind(datamat, "WaGa scr Dox" = rowMeans(datamat[, 10:11])) datamat <- datamat[,c(-2:-11)] write.csv(datamat, file ="gene_expression_merging_replicates.txt") # Ensure 'mycl' is calculated properly. mycl <- cutree(hr, h=max(hr$height)/2.2) # TODO: Rearrange the colors of the plot *_merging_replicates.png to match those in *_keeping_replicates.png! # mycol = c("YELLOW", "BLUE", "ORANGE", "CYAN", "GREEN", "MAGENTA", "GREY", "LIGHTCYAN", "RED", "PINK", "DARKORANGE", "MAROON", "LIGHTGREEN", "DARKBLUE", "DARKRED", "LIGHTBLUE", "DARKCYAN", "DARKGREEN", "DARKMAGENTA"); # Now map your clusters to colors, making sure that there's one color for each row: actualColors <- mycol[mycl] # Assign colors based on cluster assignment # Then use these 'actualColors' in your heatmap: png("miRNA_heatmap_merging_replicates.png", width=800, height=1000) heatmap.2(as.matrix(datamat), Rowv=as.dendrogram(hr), Colv=NA, dendrogram='row', labRow="", scale='row', trace='none', col=bluered(75), RowSideColors=actualColors, # Update this part srtCol=20, lhei=c(1,8), cexCol=1.7, # Increase column label font size margin=c(7,1) ) dev.off() #### cluster members ##### write.csv(names(subset(mycl, mycl == '1')),file='YELLOW.txt') write.csv(names(subset(mycl, mycl == '2')),file='BLUE.txt') write.csv(names(subset(mycl, mycl == '3')),file='ORANGE.txt') write.csv(names(subset(mycl, mycl == '4')),file='CYAN.txt') write.csv(names(subset(mycl, mycl == '5')),file='GREEN.txt') write.csv(names(subset(mycl, mycl == '6')),file='MAGENTA.txt') write.csv(names(subset(mycl, mycl == '7')),file='GREY.txt') write.csv(names(subset(mycl, mycl == '8')),file='LIGHTCYAN.txt') #write.csv(names(subset(mycl, mycl == '9')),file='RED.txt') #~/Tools/csv2xls-0.4/csv_to_xls.py gene_expression_merging_replicates.txt YELLOW.txt BLUE.txt ORANGE.txt CYAN.txt MAGENTA.txt GREEN.txt LIGHTCYAN.txt GREY.txt -d',' -o miRNA_heatmap_merging_replicates.xls #100+11+4+7+2+5+14+63=206 -
Display viral transcripts found in mRNA-seq (or small RNA) MKL-1, WaGa EVs compared to parental cells
http://xgenes.com/article/article-content/87/display-viral-transcripts-found-in-mrna-seq-mkl-1-waga-evs-compared-to-cells/ -
TODO: why miRNA_heatmap_keeping_replicates.png and miRNA_heatmap_merging_replicates.png are different while gene_expression_keeping_replicates.txt and gene_expression_merging_replicates.txt are the same?
diff our_out_on_hg38+JN707599_miRNA_keeping_replicates/gene_expression_keeping_replicates.txt miRNA_re/gene_expression_keeping_replicates.txt
diff our_out_on_hg38+JN707599_miRNA_merging_replicates/gene_expression_merging_replicates.txt miRNA_re/gene_expression_merging_replicates.txt

display our_out_on_hg38+JN707599_miRNA_keeping_replicates/miRNA_heatmap_keeping_replicates.png
display our_out_on_hg38+JN707599_miRNA_merging_replicates/miRNA_heatmap_merging_replicates.png
display miRNA_re/miRNA_heatmap_keeping_replicates.png
display miRNA_re/miRNA_heatmap_merging_replicates.png

#TODO: If necessary, in the next revision, say the plots cannot be reproduced due to the software-update.
点赞本文的读者
还没有人对此文章表态
本文有评论
没有评论
看文章,发评论,不要沉默
最受欢迎文章
- Motif Discovery in Biological Sequences: A Comparison of MEME and HOMER
- Why Do Significant Gene Lists Change After Adding Additional Conditions in Differential Gene Expression Analysis?
- Calling peaks using findPeaks of HOMER
- Updating Human Gene Identifiers using Ensembl BioMart: A Step-by-Step Guide
- pheatmap vs heatmap.2
- Should the inputs for GSVA be normalized or raw?
- PiCRUST2 Pipeline for Functional Prediction and Pathway Analysis in Metagenomics
- Setup conda environments
- Kraken2 Installation and Usage Guide
- File format for single channel analysis of Agilent microarray data with Limma?
最新文章
- MicrobiotaProcess_PCA_Group3-4.R processing Data_Karoline_16S_2025
- Phyloseq.Rmd processing Data_Karoline_16S_2025
- Processing RNAseq_2025_WT_vs_ΔIJ_on_ATCC19606
- Stihl Elektro-Heckenschneider
最多评论文章
- Updating Human Gene Identifiers using Ensembl BioMart: A Step-by-Step Guide
- The top 10 genes
- Retrieving KEGG Genes Using Bioservices in Python
推荐相似文章
Processing RNAseq_2025_WT_vs_ΔIJ_on_ATCC19606
Processing Data_Tam_RNAseq_2024_MHB_vs_Urine_ATCC19606
Workflow using PICRUSt2 for Data_Karoline_16S_2025
Viral genome assembly and recombination analysis for Data_Sophie_HDV_Sequences


