Plotting Alpha Diversities from 16S rRNA Sequencing Data
gene_x 0 like s 1232 view s
Tags: plot, R, metagenomics, 16S
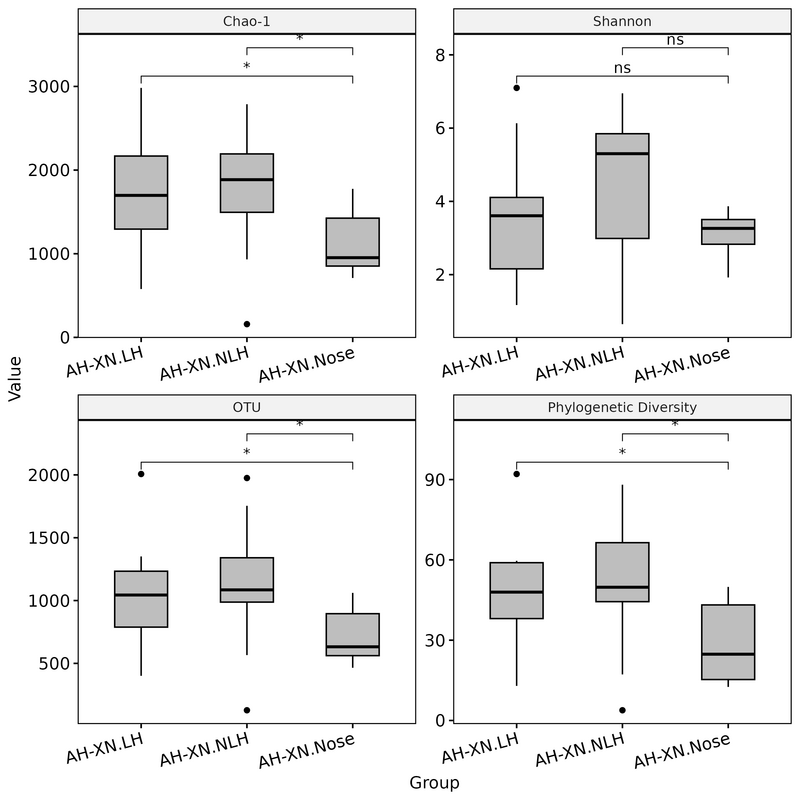
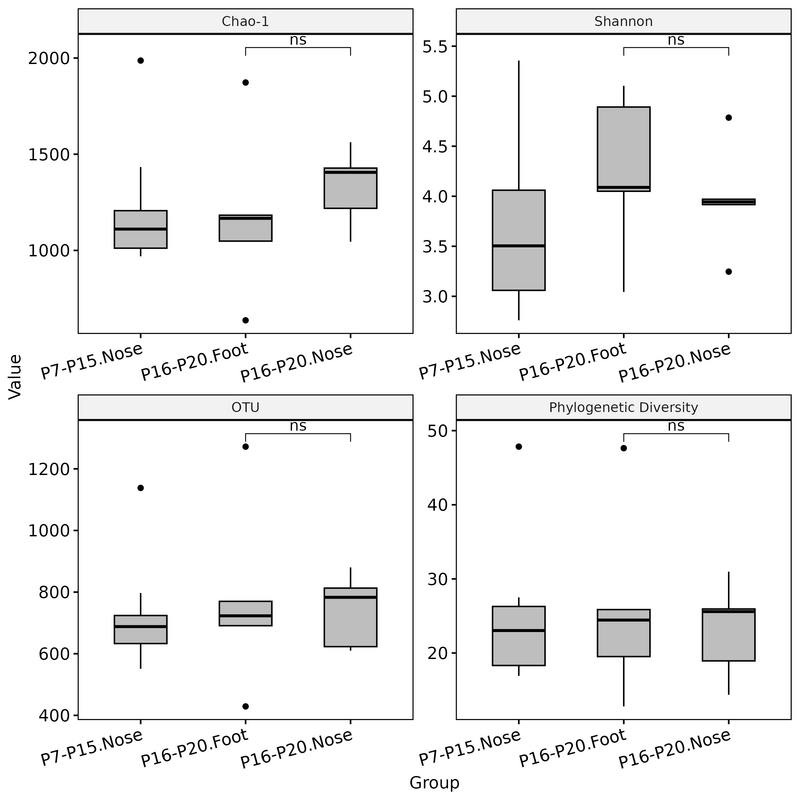
Plot Chao1 richness estimator, Observed OTUs, Shannon index, and Phylogenetic diversity. Regroup together samples from the same group.
library("readxl") # necessary to import the data from Excel file
library("ggplot2") # graphics
library("picante")
library("microbiome") # data analysis and visualisation
library("phyloseq") # also the basis of data object. Data analysis and visualisation
library("ggpubr") # publication quality figures, based on ggplot2
library("dplyr") # data handling, filter and reformat data frames
library("RColorBrewer") # nice color options
library("heatmaply")
library(vegan)
library(gplots)

ps.ng.tax <- readRDS("ps.ng.tax.rds")
hmp.meta <- meta(ps.ng.tax)
hmp.meta$sam_name <- rownames(hmp.meta)

hmp.div_qiime <- read.csv("adiv_even.txt", sep="\t")
colnames(hmp.div_qiime) <- c("sam_name", "chao1", "observed_otus", "shannon", "PD_whole_tree")
row.names(hmp.div_qiime) <- hmp.div_qiime$sam_name
div.df <- merge(hmp.div_qiime, hmp.meta, by = "sam_name")
div.df2 <- div.df[, c("Group", "chao1", "shannon", "observed_otus", "PD_whole_tree")]
colnames(div.df2) <- c("Group", "Chao-1", "Shannon", "OTU", "Phylogenetic Diversity")

#options(max.print=999999)
stat.test.Shannon <- compare_means(
Shannon ~ Group, data = div.df2,
method = "t.test"
)

div_df_melt <- reshape2::melt(div.df2)
p <- ggboxplot(div_df_melt, x = "Group", y = "value",
              facet.by = "variable",
              scales = "free",
              width = 0.5,
              fill = "gray", legend= "right")
p3 <- p +
  stat_compare_means(
    method="t.test",
    comparisons = list(c("P16-P20.Foot", "P16-P20.Nose"), c("AH-XN.LH", "AH-XN.Nose"), c("AH-XN.NLH", "AH-XN.Nose")),
    label = "p.signif",
    symnum.args <- list(cutpoints = c(0, 0.0001, 0.001, 0.01, 0.05, 1), symbols = c("****", "***", "**", "*", "ns")),
  ) +
  theme(axis.text.x = element_text(angle = 30, hjust = 1))  # add this line to rotate x-axis text
png("alpha_diversity.png", width=1000, height=800)
print(p3)
dev.off()

# Filter the data frame for each plot
groups_plot_1 <- c("AH-XN.LH", "AH-XN.NLH", "AH-XN.Nose")
groups_plot_2 <- setdiff(unique(div_df_melt$Group), groups_plot_1)

div_df_melt_plot_1 <- div_df_melt %>% filter(Group %in% groups_plot_1)
div_df_melt_plot_2 <- div_df_melt %>% filter(Group %in% groups_plot_2)

# Create and save Plot 1
div_df_melt_plot_1 <- div_df_melt_plot_1 %>% rename(Value = value)
p <- ggboxplot(div_df_melt_plot_1, x = "Group", y = "Value",
              facet.by = "variable",
              scales = "free",
              width = 0.5,
              fill = "gray", legend= "right")

p1 <- p +
  stat_compare_means(
    method="t.test",
    comparisons = list(c("AH-XN.LH", "AH-XN.Nose"), c("AH-XN.NLH", "AH-XN.Nose")),
    label = "p.signif",
    symnum.args <- list(cutpoints = c(0, 0.0001, 0.001, 0.01, 0.05, 1), symbols = c("****", "***", "**", "*", "ns")),
  ) +
  theme(axis.text.x = element_text(angle = 15, hjust = 1))  # add this line to rotate x-axis text
#png("alpha_diversity1.png", width=800, height=600)
print(p1)
#dev.off()

ggsave("alpha_diversity1.png", device="png", height = 8, width = 8)
#/usr/bin/convert alpha_diversity1.png -resize 800x800 alpha_diversity1_resized.png

# Create and save Plot 2
div_df_melt_plot_2 <- div_df_melt_plot_2 %>% rename(Value = value)
p <- ggboxplot(div_df_melt_plot_2, x = "Group", y = "Value",
              facet.by = "variable",
              scales = "free",
              width = 0.5,
              fill = "gray", legend= "right")

p2 <- p +
  stat_compare_means(
    method="t.test",
    comparisons = list(c("P16-P20.Foot", "P16-P20.Nose")),
    label = "p.signif",
    symnum.args <- list(cutpoints = c(0, 0.0001, 0.001, 0.01, 0.05, 1), symbols = c("****", "***", "**", "*", "ns")),
  ) +
  theme(axis.text.x = element_text(angle = 15, hjust = 1))  # add this line to rotate x-axis text
ggsave("alpha_diversity2.png", device="png", height = 8, width = 8)
#/usr/bin/convert alpha_diversity2.png -resize 800x800 alpha_diversity2_resized.png

#Using the function create_plot (Deprecated!)
#create_plot <- function(data, comparisons = NULL) {
#  p <- ggboxplot(data, x = "Group", y = "Value",
#                 facet.by = "variable",
#                 scales = "free",
#                 width = 0.5,
#                 fill = "gray", legend = "right") +
#    theme(axis.text.x = element_text(angle = 30, hjust = 1), strip.text = element_text(size = 15))
#    #theme(axis.title.x = element_text(angle=30, hjust=1, size = 15),    # Increase size of X-axis title
#    #      axis.title.y = element_text(size = 15),    # Increase size of Y-axis title
#    #      strip.text = element_text(size = 15),      # Increase size of Facet labels
#    #      axis.text.x = element_text(size = 12),     # Increase size of X-axis text
#    #      axis.text.y = element_text(size = 12))     # Increase size of Y-axis text
#
#  if (!is.null(comparisons)) {
#    for (comp in comparisons) {
#      if (all(comp %in% unique(data$Group))) {
#        p <- p +
#          stat_compare_means(
#            method = "t.test",
#            comparisons = list(comp),
#            label = "p.signif",
#            symnum.args = list(cutpoints = c(0, 0.0001, 0.001, 0.01, 0.05, 1), symbols = c("****", "***", "**", "*", "ns"))
#          )
#      } else {
#        warning("One or more groups in the comparison are not present in the data: ", paste(comp, collapse = ", "))
#      }
#    }
#  }
#
#  return(p)
#}
#div_df_melt_plot_2 <- div_df_melt_plot_2 %>% rename(Value = value)
#p2 <- create_plot(div_df_melt_plot_2, list(c("P16-P20.Foot", "P16-P20.Nose")))
#png("alpha_diversity_plot_2.png", width=1000, height=800)
#print(p2)
#dev.off()
点赞本文的读者
还没有人对此文章表态
本文有评论
没有评论
看文章,发评论,不要沉默
最受欢迎文章
- Motif Discovery in Biological Sequences: A Comparison of MEME and HOMER
- Why Do Significant Gene Lists Change After Adding Additional Conditions in Differential Gene Expression Analysis?
- Calling peaks using findPeaks of HOMER
- PiCRUST2 Pipeline for Functional Prediction and Pathway Analysis in Metagenomics
- Updating Human Gene Identifiers using Ensembl BioMart: A Step-by-Step Guide
- Should the inputs for GSVA be normalized or raw?
- pheatmap vs heatmap.2
- Kraken2 Installation and Usage Guide
- Setup conda environments
- File format for single channel analysis of Agilent microarray data with Limma?
最新文章
- From Genbank-ID to Phylogenetic Tree Visualization using roary, raxml and ete3
- 📊 Transposon Analysis: Sequencing Depth Requirements
- Setup the environment for lumicks-pylake and C_Trap-Multimer-photontrack.ipynb
- 🧬 Cadmium Resistance Gene Analysis in Staphylococcus epidermidis HD46
最多评论文章
- Updating Human Gene Identifiers using Ensembl BioMart: A Step-by-Step Guide
- The top 10 genes
- Retrieving KEGG Genes Using Bioservices in Python
推荐相似文章
QIIME + Phyloseq + MicrobiotaProcess (v1)

